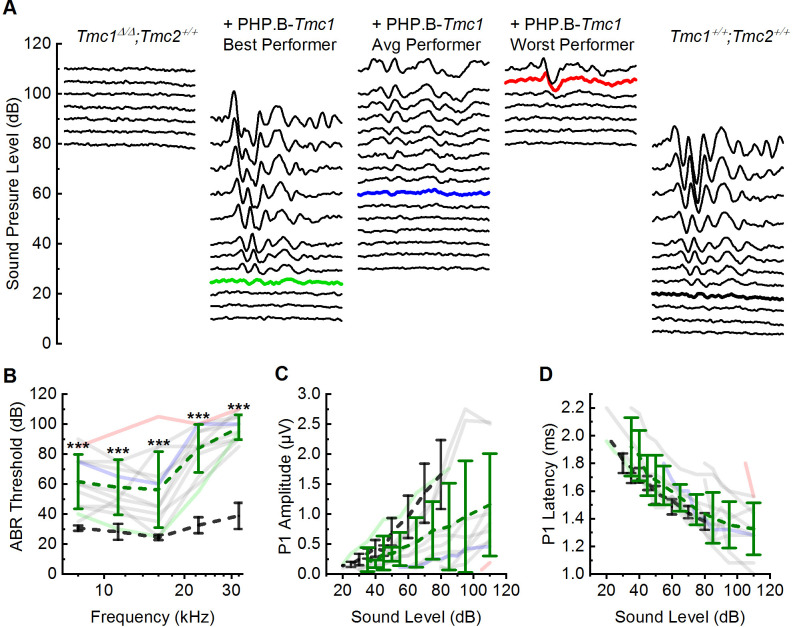
Figure 5. AAV9-PHP.B-Tmc1 restores ABR thresholds in Tmc1Δ/Δ mice.
(A) Representative ABR waveforms recorded at postnatal day 28 (P28) using 16 kHz tone bursts at sound pressure levels of increasing 5 dB increments. Waveforms from uninjected Tmc1Δ/Δ mouse (left), three Tmc1Δ/Δ mice injected with AAV9-PHP.B-Tmc1, representing best (green), average (blue), and worst (red) recovery and one wild-type (WT) control (black) are shown. Thresholds determined by the presence of Peak 1 and indicated by bolded, colored traces. (B) ABR thresholds plotted as a function of stimulus frequency for 12 Tmc1Δ/Δ mice injected with AAV9-PHP.B-Tmc1 tested at P28 (gray traces). Mice with the best (green), median (blue), and worst (red) recovery are indicated and correspond to the best, average, and worst traces in (A). Black dotted lines show mean ± SD thresholds from eight previously tested WT mice. Green dotted line shows mean ± SD thresholds from the 12 injected mice. (C) Peak 1 amplitudes measured from 16 kHz ABR waveforms (A) for 12 Tmc1Δ/Δ mice injected with AAV9-PHP.B-Tmc1. Colors correspond to conditions indicated in B. (D) Peak 1 latencies measured from 16 kHz ABR waveforms (A) for 12 Tmc1Δ/Δ mice injected with AAV9-PHP.B-Tmc1. Colors correspond to conditions indicated in B.

