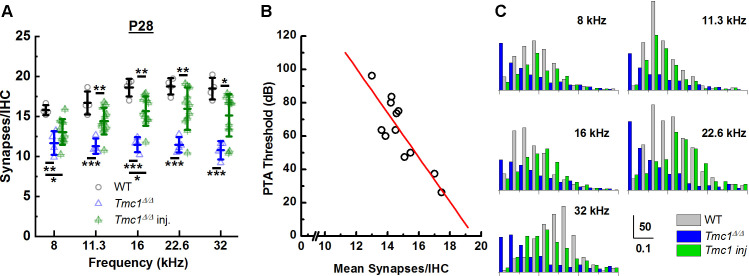
Figure 6. AAV9-PHP.B-Tmc1 preserves synapse counts and ribbon volume distributions in Tmc1Δ/Δ mice.
(A) The mean number of synapses/inner hair cell (IHC) was counted at each frequency region from postnatal day 28 (P28) wild-type (WT) (black), Tmc1Δ/Δ (blue), and injected Tmc1Δ/Δ (green) mice. WT and Tmc1Δ/Δ ribbon counts are the same as those depicted in Figure 3. Individual points represent counts from one mouse. Frequency-specific synapse counts did not differ by group (two-way ANOVA; p = 0.49 based on two-way interaction between genotype and frequency; Supplementary file 3C). Bolded lines indicate mean ± SD. Black horizontal bars and asterisks represent statistically significant differences in group means (multiple pairwise comparisons, *p < 0.05, **p < 0.01, ***p < 0.001). Number of cochleas: 4 WT, 4 Tmc1Δ/Δ cochleas, 11–12 injected Tmc1Δ/Δ cochleas. (B) Pure tone average (PTA) thresholds were calculated for frequencies between 8 and 22.6 kHz for 12 Tmc1Δ/Δ mice injected with 1 µL AAV9-PHP.B-Tmc1 at P1. PTA thresholds were plotted as a function of the mean synapses/IHC (circles) based on synapse counts from corresponding cochlear regions. The data were fitted with a linear regression (red line) that had a slope of 13 dB/synapse, a correlation coefficient of 0.86; p = 0.00032. (C) Histograms showing distributions of ribbon volumes from confocal z-stacks plotted for each frequency region. Scale bars indicate volume counts on the Y-axis and ribbon volumes in µm3 on the X-axis. Data were obtained from four P28 WT (gray) cochleas, four Tmc1Δ/Δ (blue) cochleas, and four injected Tmc1Δ/Δ (green) cochleas for each of the 8–32 kHz regions.

