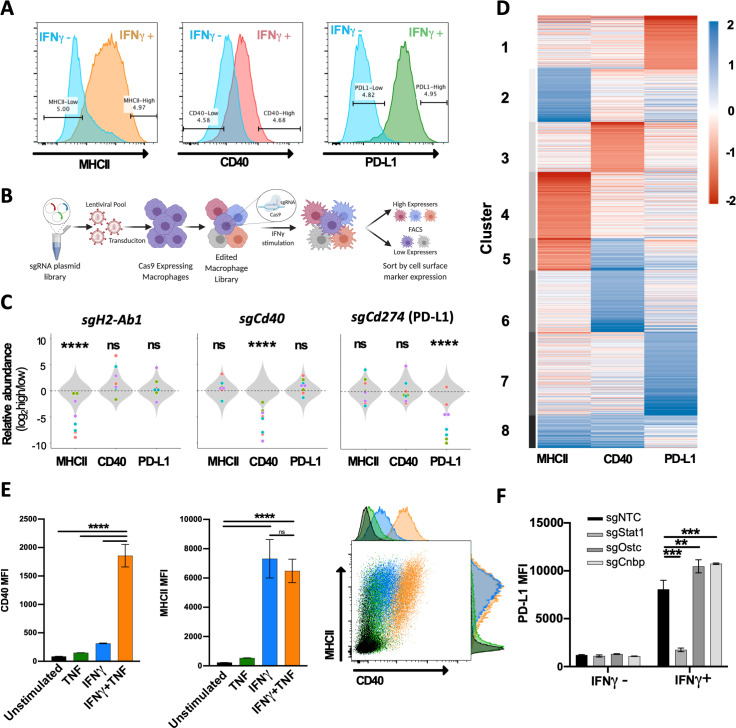
Figure 1. Forward genetic screen to identify regulators of the IFNγ response.
(A) Representative histograms of the three selected cell surface markers targeted in macrophage CRISPR screens: MHCII, CD40, and PD-L1. Blue histograms indicate expression of each marker in unstimulated macrophages, and alternatively colored histograms show expression following 24 hr stimulation with recombinant murine IFNγ (10 ng/mL). Gates used for sorting ‘high’ and ‘low’ populations are shown. (B) Schematic of CRISPR screens. (C) Relative enrichment of select positive control (points) and all 1000 non-targeting control (NTC) sgRNAs (gray distribution) are plotted as a function of their log2 fold enrichment (‘high’ vs. ‘low’ bins). Data are from both replicate selections for each sgRNA (sgRNA denoted by shape). (D) Heatmap of β scores from CRISPR analysis, ordered according to k-means clustering (k = 8) of the 5% most enriched or depleted genes in each screen. (E) Macrophages were stimulated for 24 hr with TNF (25 ng/mL), IFNγ (10 ng/mL), or both TNF and IFNγ. Mean fluorescence intensity (MFI) of CD40 and MHCII was quantified by flow cytometry. Data are mean ± standard deviation for three biological replicates. Representative scatter plot from two independent experiments is provided. (F) Macrophages transduced with sgRNA targeting Stat1, Ostc, Cnbp, or a NTC were cultured with or without IFNγ for 24 hr, and cell surface expression of PD-L1 (MFI) was quantified by flow cytometry. For each genotype, data are the mean of cell lines with two independent sgRNAs ± standard deviation. Data are representative of three independent experiments. Statistical testing in panel (C) was performed with Tukey’s multiple comparisons test. Within each screen, the sgRNA effects for each gene were compared to the distribution of NTC sgRNAs. Statistical testing in panels (E) and (F) was performed by one-way ANOVA with Holm–Sidak multiple comparisons correction. p-Values of 0.05, 0.01, 0.001, and 0.001 are indicated by *, **, *** and ****, respectively.

