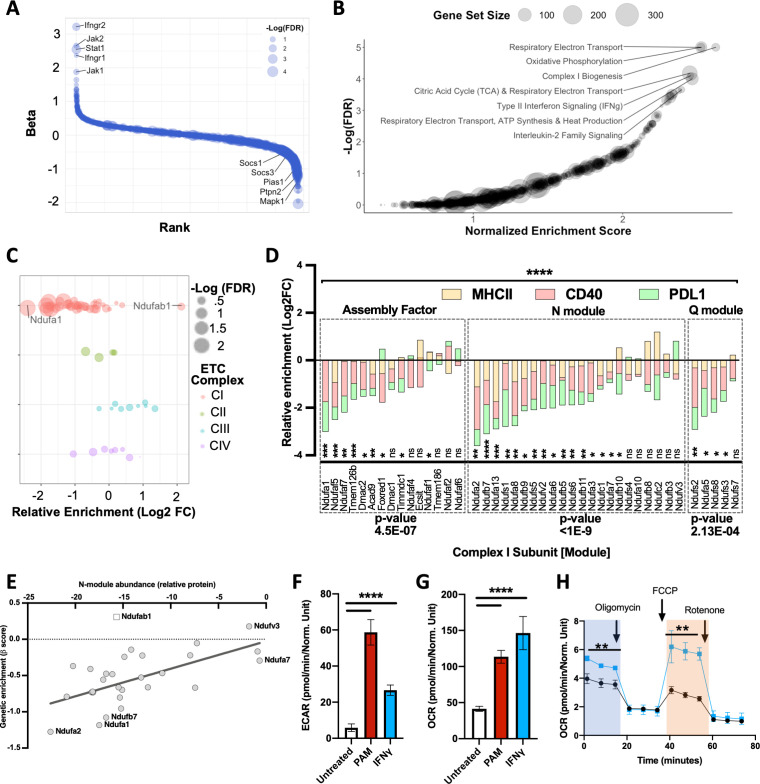
Figure 2. Global analysis of knockout (KO) libraries implicates mitochondrial complex I is a positive regulator of the IFNγ response.
(A) Rank plot of the combined analysis for all genome-wide KO screens. Gene ranks (x-axis) were determined by maximal likelihood estimation (MLE). Known positive (left) and negative (right) regulators of IFNγ-mediated signaling are highlighted. The q-value (false discovery rate [FDR]) for each gene is indicated by dot size (-log10 FDR). (B) Gene set enrichment analysis (GSEA) is based on the ranked list of positive regulators. Non-redundant pathways with a normalized enrichment score (NES) exceeding 2.0 and an FDR below 0.025 are labeled. (C) Relative enrichment (log2 fold change between ‘high’ and “low” bins) of genes that comprise the mitochondrial respirasome (GeneOntology 0005746) and were targeted in the CRISPR KO library. Respirasome components are grouped by electron transport chain (ETC) complex. FDR is based on MAGeCK-MLE. (D) Screen-specific enrichment score is plotted for complex I structural subunits and assembly factors. The statistical enrichment of a gene (e.g., Ndufa1) or module (e.g., N) was calculated using a binomial distribution function to calculate the probability that observed sgRNAs under examination would be depleted or enriched given the expected median probability. p-Values of 0.05, 0.01, 0.001, and 0.001 are indicated by *, **, ***, and ****, respectively. (E) Correlation between the relative effect of each complex I subunit on the structural integrity of the N-module (x-axis) with the relative requirement of each complex I subunit for the IFNγ response (y-axis; β score, as in panel D). The Pearson correlation coefficient (r) was calculated to be 0.6452 (95% confidence interval 0.3584–0.8207); p-value=0.0002. As Ndufab1 (empty square) is an essential gene, its detection in the library indicates editing did not eliminate function; therefore, it was excluded from correlation analysis. (F) Following stimulation with IFNγ or PAM, extracellular acidification rate (ECAR)and (G) Oxygen consumption rate (OCR) values were measured by Seahorse in primary bone marrow-derived macrophages (BMDMs). Basal OCR and ECAR were determined 24 hr after stimulation with 10 ng/mL IFNγ or 200 ng/mL PAM. ****p<0.0001 by one-way ANOVA. (H) In a parallel experiment, the indicated chemical modulators were added to resting (Black) or IFNγ-activated (Blue) BMDMs at the indicated time points after initiating metabolic monitoring and the OCR response was monitored. Basal OCR (blue box) and maximal OCR (red box) are highlighted (right panel). **p<0.01 by two-tailed t-test.

