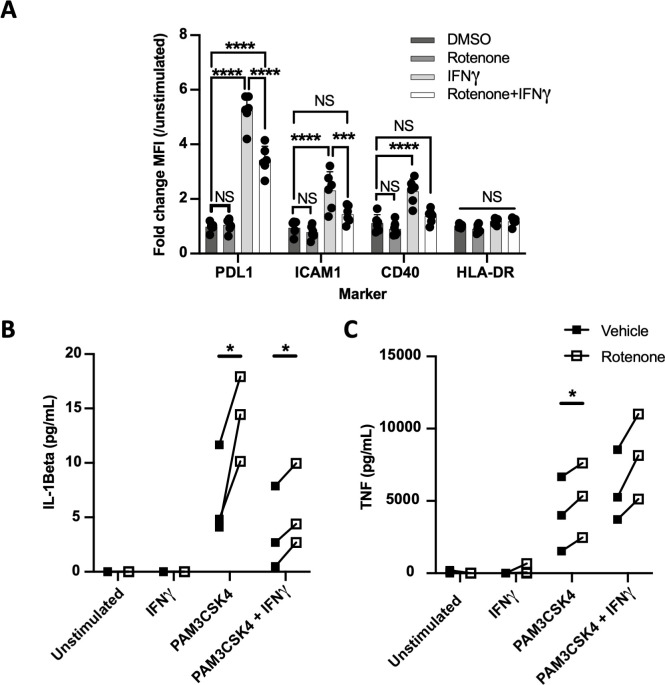
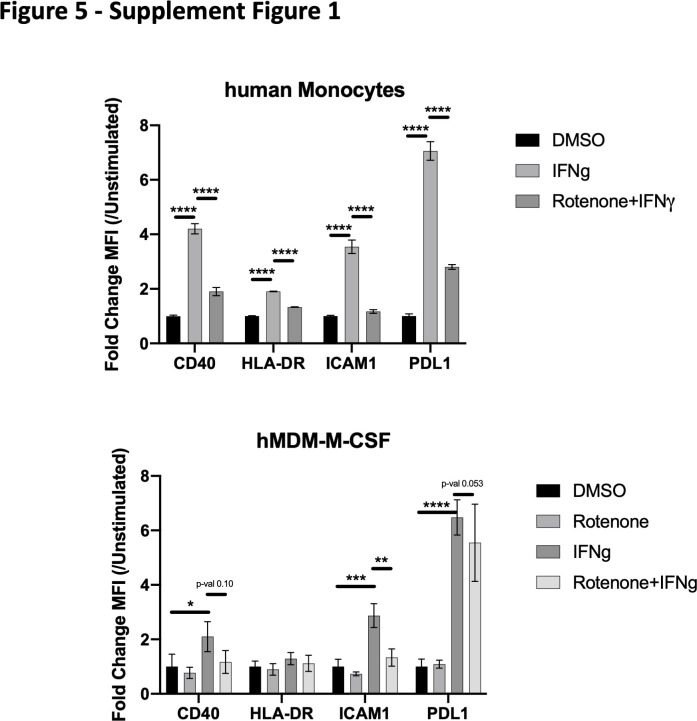
Figure 5. Complex I is specifically required for IFNγ signaling in human cells.
(A) CD14+ monocytes from healthy human donors were differentiated into macrophages with GM-CSF. Mean fluorescence intensity (MFI) of cell surface markers PD-L1, ICAM1, CD40, and HLA-DR was determined by flow cytometry following stimulation with IFNγ and/or inhibition of complex I with rotenone (10 µM) for 24 hr. Data are representative of two independent experiments, and values are normalized to donor-specific unstimulated/vehicle control. Mean ± standard deviation for six biological replicates of each condition. Differences were tested by two-way ANOVA using the Sidak–Holm method to correct for multiple hypothesis testing. (B, C) Quantification of IL-1β and TNF production from primary human macrophages, measured by ELISA from cell supernatants following stimulation. Lines connect values for individual donors treated with vehicle (DMSO, black squares) or rotenone (empty squares). Differences were tested by repeated measures two-way ANOVA using the Sidak–Holm method to correct for multiple hypothesis testing. p-Values of 0.05, 0.01, 0.001, and 0.001 are indicated by *, **, ***, and ****, respectively.


