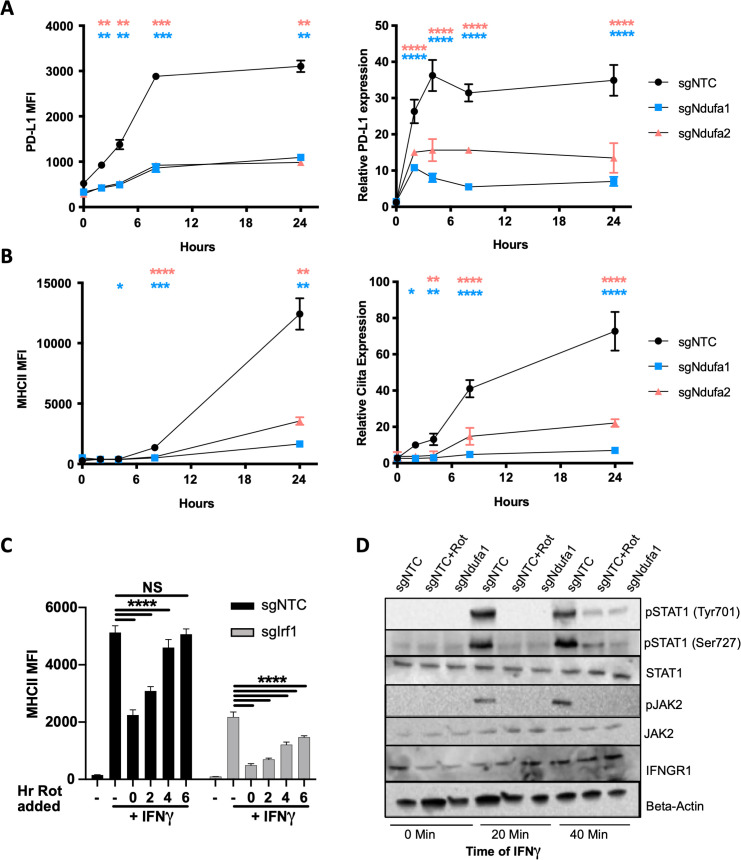
Figure 6. Complex I inhibition reduces IFNγ receptor activity.
(A) PD-L1 transcript was quantified by qRT-PCR using ΔΔCt relative to β-actin in macrophages of the indicated genotype after stimulation with 10 ng/mL IFNγ. PD-L1 mean fluorescence intensity (MFI) was determined at the same time points by flow cytometry. (B) Ciita transcript was quantified by qRT-PCR using ΔΔCt relative to β-actin Gapdh in macrophages of the indicated genotype after stimulation with 10 ng/mL IFNγ. MHCII MFI was determined at the same time points by flow cytometry. Data shown are from biological triplicate samples with technical replicates for RT-PCR experiments and are representative of two independent experiments. (C) sgNTC (left) or sgIrf1 (right) macrophages were cultured for 24 hr with or without IFNγ stimulation. At 2 hr intervals post-IFNγ stimulation, rotenone was added. After 24 hr of stimulation, cells were harvested and surface expression of MHCII (MFI) was quantified by flow cytometry. Data are mean ± standard deviation for three biological replicates and are representative of two independent experiments. Statistical testing was performed by one-way ANOVA with Tukey’s correction for multiple hypothesis testing. (D) Control (non-targeting control [NTC]) or sgNdufa1 macrophages were stimulated with IFNγ for the indicated times while NTC macrophages were pretreated with 10 μM rotenone for 2 hr prior to IFNγ stimulation. Cell lysates analyzed by immunoblot for STAT1 abundance and phosphorylation (Y701 and S727), JAK2 abundance and phosphorylation (Y1007/8), and IFNGR1. β-Actin was used as a loading control. Data are representative of three independent experiments. Results shown are from a single experiment analyzed on three parallel blots. p-Values of 0.05, 0.01, 0.001, and 0.001 are indicated by *, **, ***, and ****, respectively.

