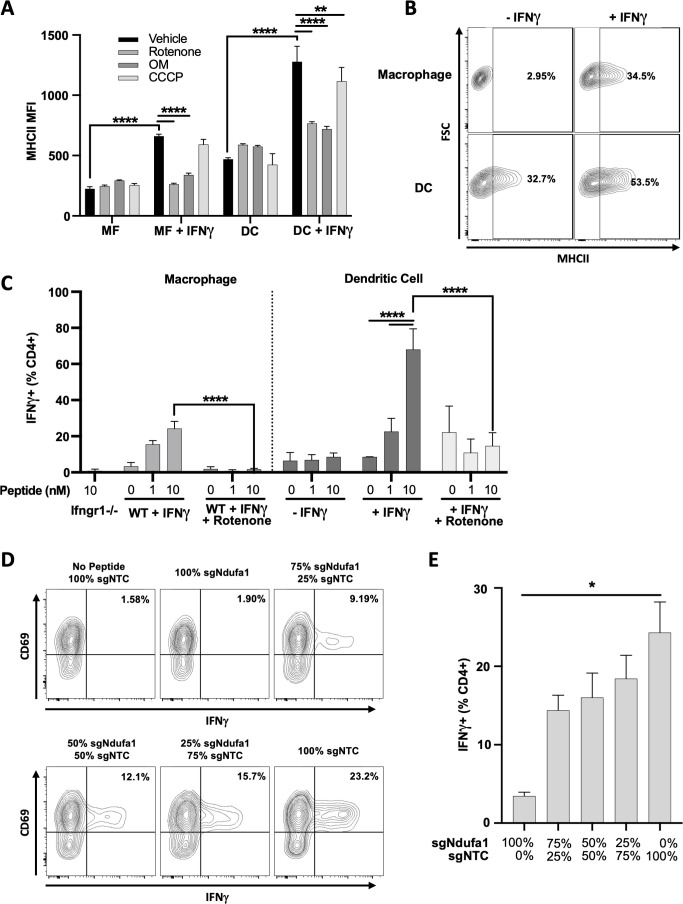
Figure 7. Mitochondrial respiration in antigen-presenting cells (APCs) is required for IFNγ-dependent T cell activation.
(A) Cell surface expression of MHCII (mean fluorescence intensity [MFI]) in macrophages (MF) or dendritic cells (DCs) derived from conditionally immortalized progenitor lines. IFNγ was added for 24 hr where indicated. Cells were treated with vehicle (DMSO), rotenone (10 µM), oligomycin (OM, 2.5 µM), or carbonyl cyanide m-chlorophenyl hydrazone (CCCP) concurrent with IFNγ. Data are three biological replicates and are representative of at least two independent experiments. (B) Contour plot of macrophage (top row) or DC (bottom row) MHCII expression in the absence of (left column) or following (right column) stimulation with IFNγ for 24 hr. Representative samples were selected from (A). The percent MHCII positive are indicated for each of the conditions. (C) CD4+ T cell activation as measured by the percent of live cells positive for IFNγ by intracellular cytokine staining. Prior to co-culture with T cells, APCs were stimulated with the indicated combinations of IFNγ (10 ng/mL), and/or rotenone (10 µM) for 24 hr. After washing and pulsing with ESAT-61–15 at the indicated concentrations (nm), T cells were added to APCs at an effector to target (E:T) ratio of 1:1 and co-cultured for a total of 5 hr. Data are representative of two independent experiments. Data are mean ± standard deviation for three biological replicates. Statistical testing was performed by one-way ANOVA with Tukey’s correction for multiple hypothesis testing. (D, E) sgNdufa1 or non-targeting control (NTC) macrophages were differentiated from immortalized progenitors and mixed at the ratios indicated (labeled as percent of knockout [KO] cells). Mixed cultures were stimulated with IFNγ for 24 hr, peptide loaded, and co-cultured with CD4+ T cells (E:T 1:1). Production of IFNγ was measured by ICS and quantified as the percent of cells positive for staining by flow cytometry. Representative contour plots (D) and quantification (E) of the experiment are shown. Data shown are for biological triplicate samples and are representative of two independent experiments. p-Values of 0.05, 0.01, 0.001, and 0.001 are indicated by *, **, ***, and ****, respectively.


