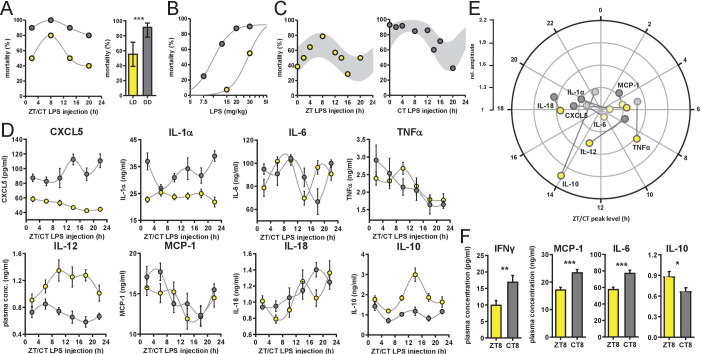
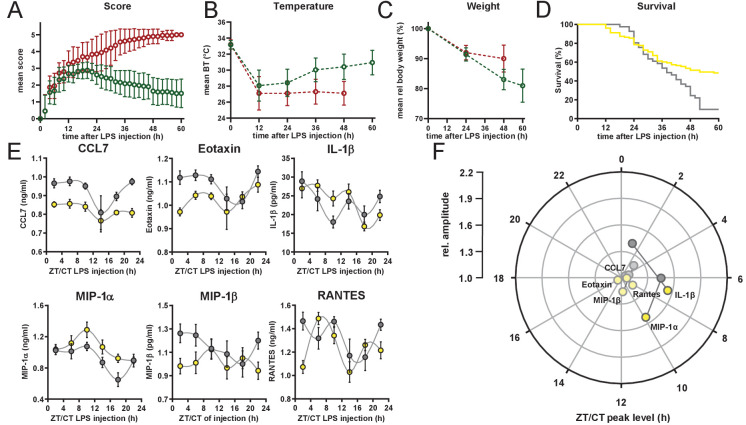
Figure 1. Time-of-day-dependent mortality in LPS-treated mice is controlled by the circadian system and light conditions.
(A) LPS (30 mg/kg, i.p.) induced mortality in C57Bl/6 mice (n=10 per time point) kept either in LD 12:12 (yellow) or in DD (gray). Left graph: single time points plottet in either Zeitgeber Time [ZT] or Circadian Time [CT] depending on respective light conditions; right graph: mean mortality of LD or DD light condition. Error bars represent 95% confidence intervals (n=40 per group, *** p=0.0005). (B) LPS dose-mortality curves of mice challenged at four time points in LD versus DD (overall n=40 mice per dosage). Gray lines were calculated by fitting an allosteric model to each group. (C) Mice (n=10–14 per time point) were challenged with half-lethal doses of LPS (30 mg/kg, i.p.), for mice kept in LD (left panel) or 13 mg/kg, i.p., for mice kept in DD (right panel). Mortality was assessed 60 hr after LPS injection. To perform statistical analyses, mortality rates were transformed to probability of death in order to compute sine fit using logistic regression and F-test (LD, p=0.06; DD, p=0.001; gray-shaded areas indicate 95% confidence intervals). (D) and (E) Time-of-day-dependent cytokine profiles in peripheral blood of C57Bl/6 mice (n=14 per time point) challenged with half-lethal doses of LPS (30 mg/kg, i.p., for mice kept in LD (yellow) or 13 mg/kg, i.p., for mice kept in DD (gray)) and sacrificed 2 hr later. (E) Relative amplitudes and phases of cytokines shown in (D). Light-colored circles represent non-significant circadian rhythms (p-value>0.05 ) as determined by non-linear least square fit and consecutive F-test (see also Materials and methods section). (F) Cytokine levels in peripheral blood from mice (n=10 per time point) challenged with LPS (13 mg/kg, i.p.) at either ZT8 (LD) or CT8 (DD) conditions (T-test, *** p<0.001, ** p<0.01, * p<0.05).


