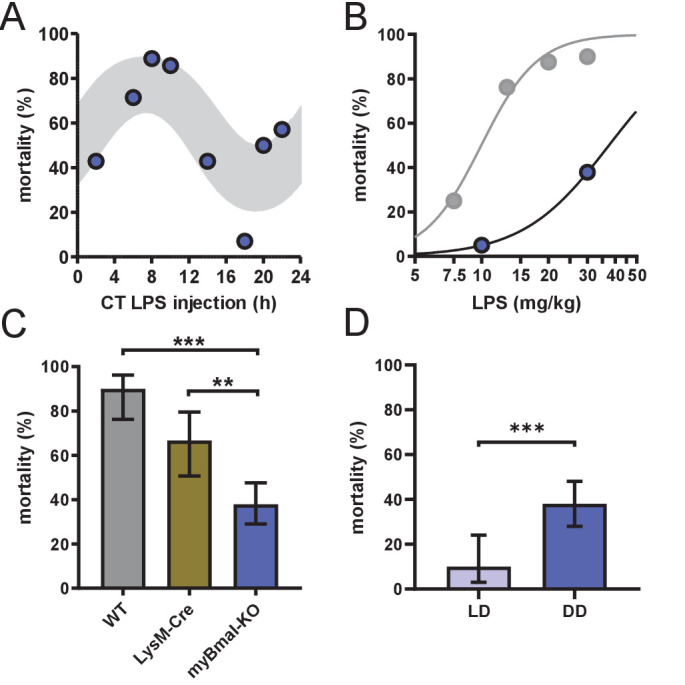
Figure 2. myBmal-KO mice show decreased and circadian time-dependent susceptibility to LPS.
(A) Circadian mortality in myBmal-KO mice. Mice kept in DD (n=10–14 per group) were challenged with half-lethal doses of LPS (30 mg/kg, i.p.) at indicated time points. Mortality was assessed 60 hr after LPS injection. Statistics were performed as in Figure 1C, (p=0.0009; gray shaded area indicates 95% confidence interval). (B) LPS dose-mortality curves of mice challenged at 4–8 time points across 24 hr in constant dark conditions. About threefold decrease of susceptibility to LPS in myBmal-KO mice (blue circles) as compared to wild-type mice (gray circles – re-plotted from Figure 1B kept in DD). Gray lines were calculated by fitting an allosteric model to each group. (C) Reduced mean mortality in myBmal-KO mice (n=103) compared to control strains LysM-Cre (n=39) or C57Bl/6 wild-type (WT, n=40). All mice were kept in DD and challenged with 30 mg/kg LPS i.p. Mean values and 95% confidence intervals from WT and myBmal-KO mice were calculated from experiments shown in Figure 1C (WT) and (A) (myBmal-KO)(** p=0.0021, *** p¡0.0001). (D) Constant dark conditions render mice more susceptible to LPS (30 mg/kg LPS) independent of Bmal1 in myeloid lineage cells (n=40 (LD) and n=103 (DD)). ( ** p<0.01, *** p<0.001).


