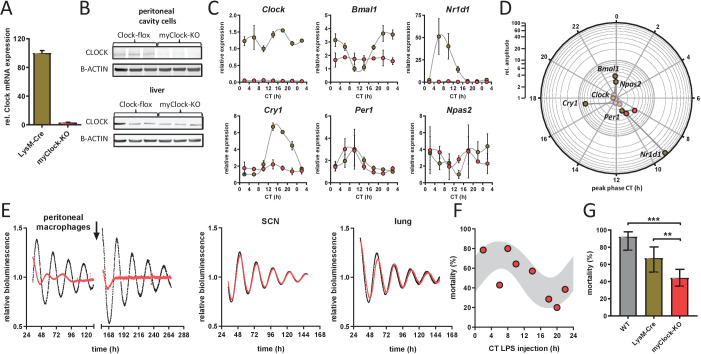
Figure 3. Conditional myClock-KO mice show circadian pattern in mortality by endotoxic shock.
(A) and (B) Reduced levels of Clock mRNA and protein in myeloid lineage cells of myClock-KO mice. (A) Mean values of normalized mRNA expression values of time-series shown in (C) (n=21 mice per condition, p<0.0001, t-test). (B) Protein levels by immunoblot in peritoneal cavity cells and liver of myClock-KO and Clockflox/flox control mice (n=3). (C) Relative mRNA levels of selected clock genes in peritoneal macrophages from LysM-Cre (brown circles) or myClock-KO (red circles) mice, both kept in DD, at indicated circadian times. Phase and amplitude information are depicted in (D) as analyzed by Chronolyse. Non-significant circadian expression (p>0.05) are depicted in light red (myClock-KO) or light brown (LysM-Cre control). (E) Representative bioluminescence recordings of peritoneal macrophages, SCN or lung tissue from myClock-KO or wild-type mice crossed with PER2:Luc reporter mice (color coding as before). Black arrow indicates time of re-synchronization by dexamethasone treatment (detrended data). (F) Circadian pattern in endotoxic shock mortality despite deficiency of CLOCK in myeloid lineage cells. Mice (DD, n=10–14 per time point) were challenged with half-lethal doses of LPS (30 mg/kg, i.p.) at indicated time points. Mortality was assessed 60 hr after LPS injection. Statistic were performed as in Figure 1C (p=0.005, gray shaded area indicates 95% confidence interval). (G) Reduced mean mortality (at 30 mg/kg LPS) in mice deficient of myeloid CLOCK (n=103) compared to control strains LysM-Cre (n=39) or C57Bl/6 (wild-type, n=40). First two bars where re-plotted from Figure 2C. Error bars represent 95% confidence intervals (* p=0.0192, *** p = 0.0001).


