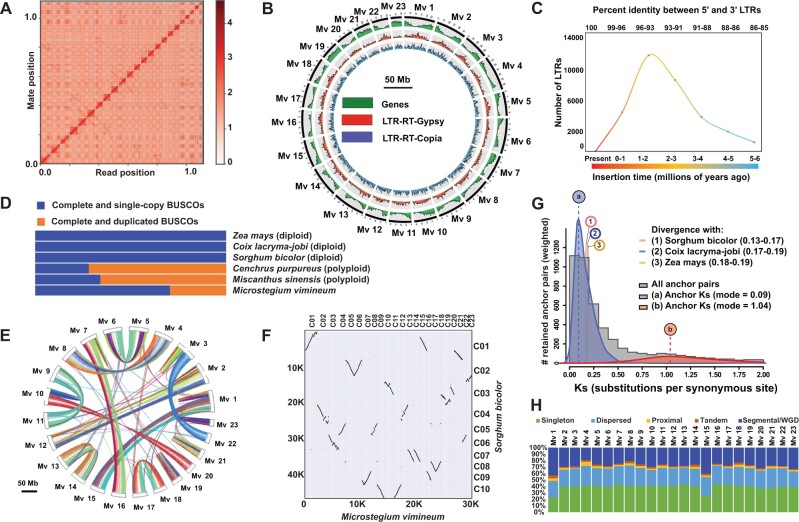
Fig. 1.
(A) Linkage density heatmap of the Microstegium vimineum genome. The x and y axes represent the mapping positions of the first and second read in a read pair, respectively. The diagonal lines from lower left to upper right in the plot represent each of the 23 M. vimineum pseudochromosomes. Dots (sequences) outside the diagonal are likely repetitive sequences that occur in multiple chromosomes. (B) Circos plot of M. vimineum genome assembly showing distributions of genes (green), Gypsy LTR-RTs (red), and Copia LTR-RTs (blue). (C) Insertion age estimates of LTR-retrotransposons in Ma based on a grass-specific LTR mutation rate (Ma and Bennetzen 2004). (D) BUSCO assessment results of orthologs among M. vimineum, closely related diploids (Sorghum bicolor, Coix lacryma-jobi, Zea mays), and polyploids (Miscanthus sinensis and Cenchrus purpureus). (E) Interchromosomal synteny with links representing syntenic blocks between M. vimineum chromosomes. (F) Macrosynteny dotplot of M. vimineum and S. bicolor chromosomes displaying large-scale duplications, inversions, and translocations. (G) The frequency distributions of synonymous substitution rates (Ks) of homologous gene pairs located in the collinearity blocks of M. vimineum. The Ks distribution for M. vimineum is shown in gray, with two WGD peaks indicated in blue and red. The vertical lines labeled “a” and “b” indicate the modes of these peaks, which are taken as Ks-based WGD age estimates. The numbered vertical lines represent rate-adjusted mode estimates of one-to-one ortholog Ks distributions between M. vimineum and closely related species, representing speciation events. (H) Distributions of gene duplicate origins across each chromosome in M. vimineum genome.

