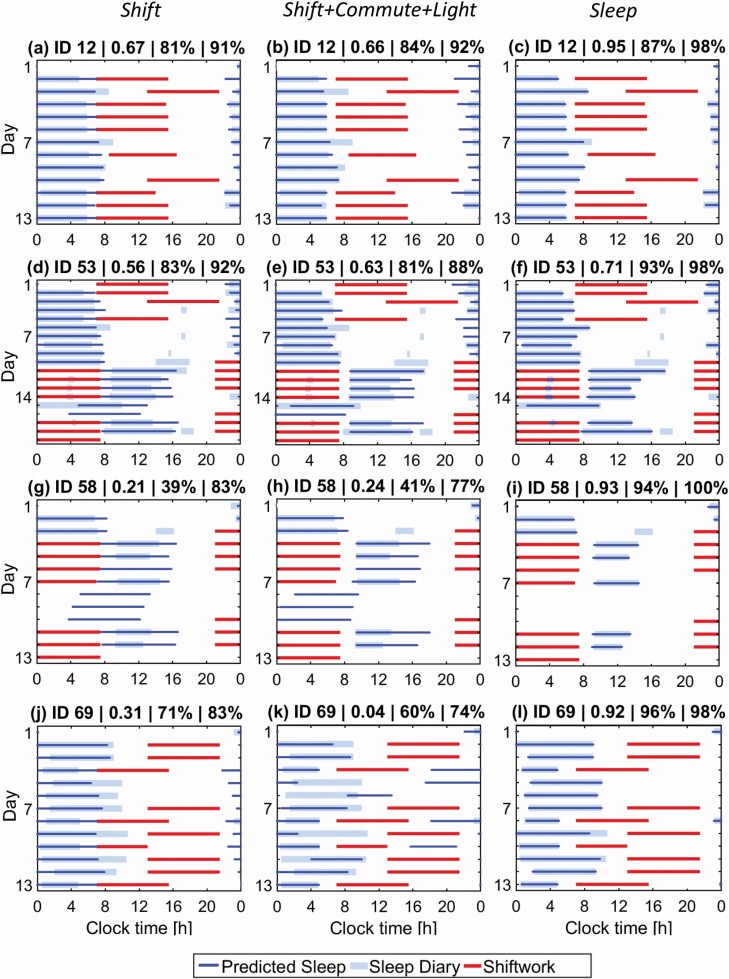
Figure 3.
Example raster plots comparing predicted and self-reported sleep during shiftwork schedules. Three evaluation constraints are illustrated: Shift in the left column, Shift + Commute + Light in the middle, and Sleep in the right. (a–c) Raster plots for participant 12 for Shift, Shift + Commute + Light, and Sleep constraints; (d–f) raster plots for participant 53; (g–i) raster plots for participant 58; and (j–l) raster plots for participant 69. Panel titles show participant ID, surrogate normalized sleep overlap (0–1), percentage sleep overlap, and percentage state overlap.

