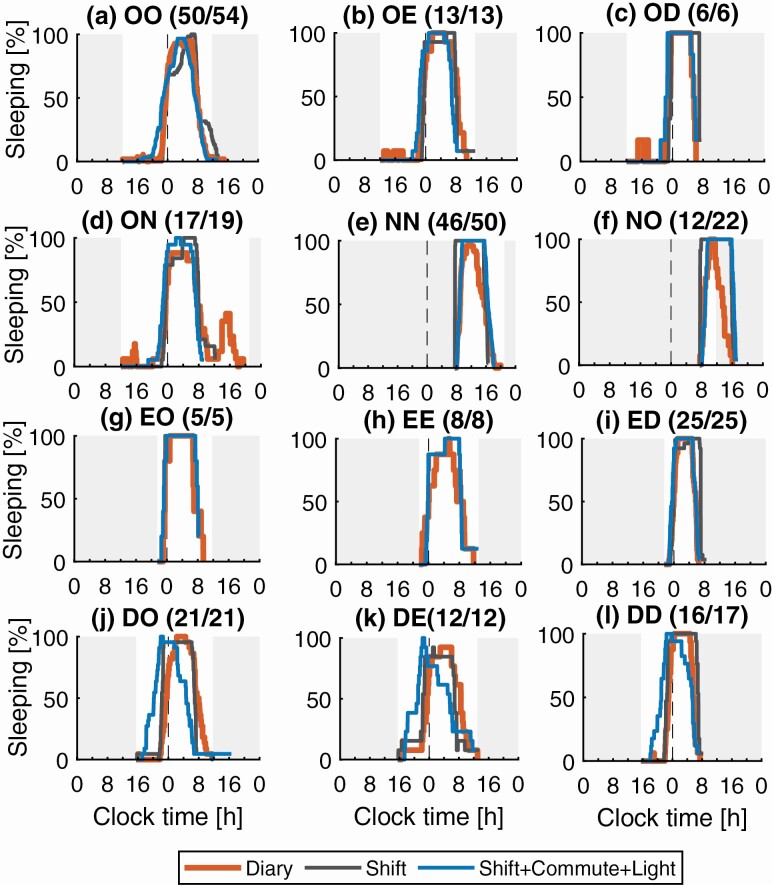
Figure 4.
Comparison of predicted and reported sleep distributions for common shift to shift transitions. Model predictions are shown for Shift and Shift+Commute+Light inputs. Shifts notation is: D day shift; E evening shift; N night shift; and O day off. (a) Sleep distribution for the day off to day off transition, OO; (b) day off to evening shift, OE; (c) day off to day shift, OD; (d) day off to night shift, ON; (e) night shift to night shift, NN; (f) night shift to day off, NO; (g) evening shift to day off, EO; (h) evening shift to evening shift, EE; (i) evening shift to day shift, ED; (j) day shift to day off, DO; (k) day shift to evening shift, DE; (l) day shift to day shift, DD. The Y-axis shows percentage of participants sleeping at any time between shifts of a given type. The white background indicates the time between a shift end and the subsequent shift start. The title for each panel contains: transition-type; and number of transitions with reported sleep/total number of transitions. Sleep-based inputs produce predicted distributions that are almost identical to the study data—therefore, those results are omitted from the figure.

