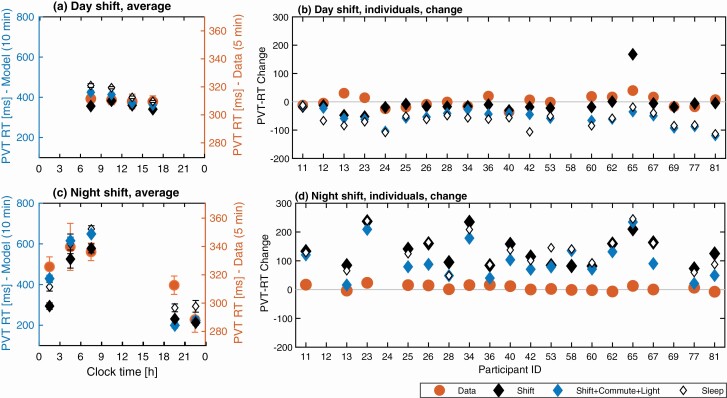
Figure 7.
Comparison of study data and model predictions for objective performance measured with the PVT RT. Model predictions for three evaluation constraints are shown: Shift, Shift + Commute + Light, and Sleep. (a) Group average PVT RT profile across all participants on the day shift against clock time. (b) Individual predictions and study data for PVT RT change between the start and end of day shift ). (c) Group average PVT RT profile on the night shift. (d) Predictions and study data for PVT RT change between the start and end of the night shift for each participant. In (a, c), the PVT RT values are binned in three-hour blocks and are plotted in the middle of each bin. Glyphs show mean values within each bin with bars indicating plus and minus the standard error in the mean. The experimental data (Data) are plotted against the range on the right Y-axis, model predictions are shown against the range on the left Y-axis in (a) and (c). The y-axis scales are identical in (b) and (d).

