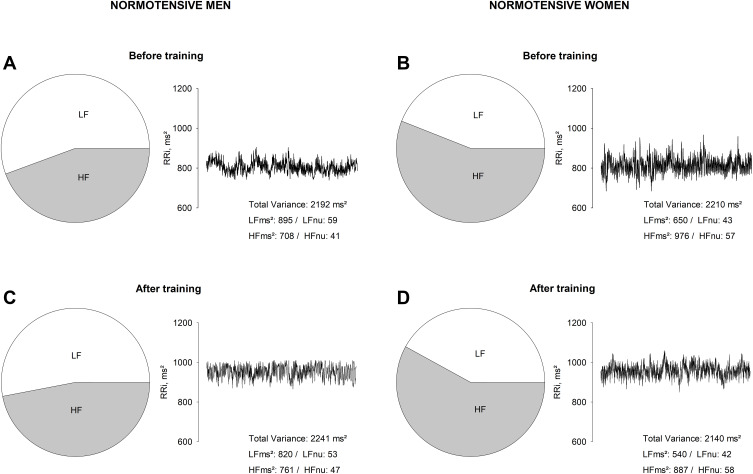
Figure 2.
Representative illustration of heart rate variability parameters through spectral analysis in normotensive men (A and C) and women (B and D) obtained in our laboratory, before and after 16 weeks of aerobic physical training. The RR intervals (RRi) in absolute units (ms2) time series are illustrated by the line chart and was used the low-frequency (LF) and high-frequency (HF) bands in normalized units (nu) to indicated the relationship between autonomic modulation balance by the pie chart.

