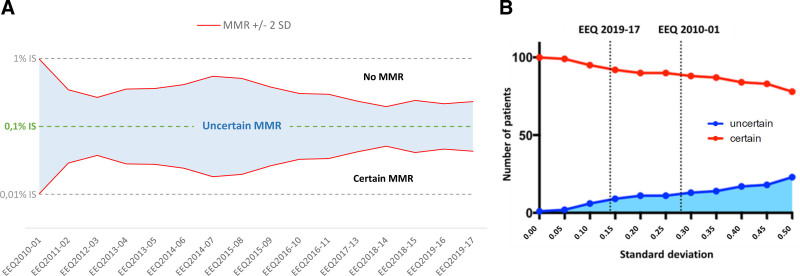
Figure 3.
Impact of BCR-ABL1 EEQ results on the ability of laboratories to determine MMR with certainty. (A) Improvement in laboratory performance led to a reduction in uncertainty around MMR, defined as a BCR-ABL1/ABL1 log ratio of 0.1%. The figure represents national SD evolution (BCR-ABL1/ABL1 log ratio aligned on IS, calculated using EEQ results from all laboratories) over time (EEQ campaigns from 2010 to 2019). The limit of measurement uncertainty is 2 SDs: every point above MMR+2SD is not an MMR point, whereas every point below MMR-2SD is an MMR point; any point between MMR ±2 SD is an uncertain MMR point. (B) At the clinical level, this translated into a better evaluation of MMR: when SD decreases, the number of patients with certain MMR status increases. By extrapolating national SD results in 2010 and 2019 for a cohort of 101 patients in first-line treatment for chronic-phase CML (52 of whom were in MMR at 1 year), we estimated a reduction by a factor of 4.7 in the number of patients whose MMR would have been uncertain. The red curve represents patients whose MMR status is certain, while the blue one represents patients whose MMR is uncertain. EEQ = external evaluation of quality; IS = international scale; MMR = molecular major response; SD = standard deviation.

