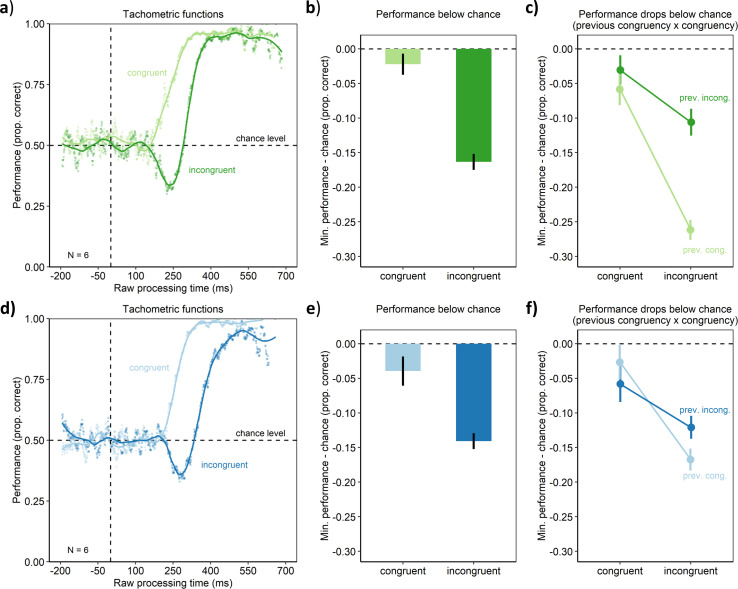
Figure 2. Behavioral results of Experiment 1 (upper panel) and Experiment 2 (lower panel).
(a, d). Tachometric functions depicting performance as a function of RPT for the congruent and incongruent conditions of the aggregate participant. (b, e) In contrast to the congruent condition, the incongruent condition led to a larger drop of performance below chance. (c, f) The drop of performance below chance was larger, when the previous trial was congruent (prev. cong.) rather than incongruent (prev. incong.). Error bars are standard errors from a bootstrap.

