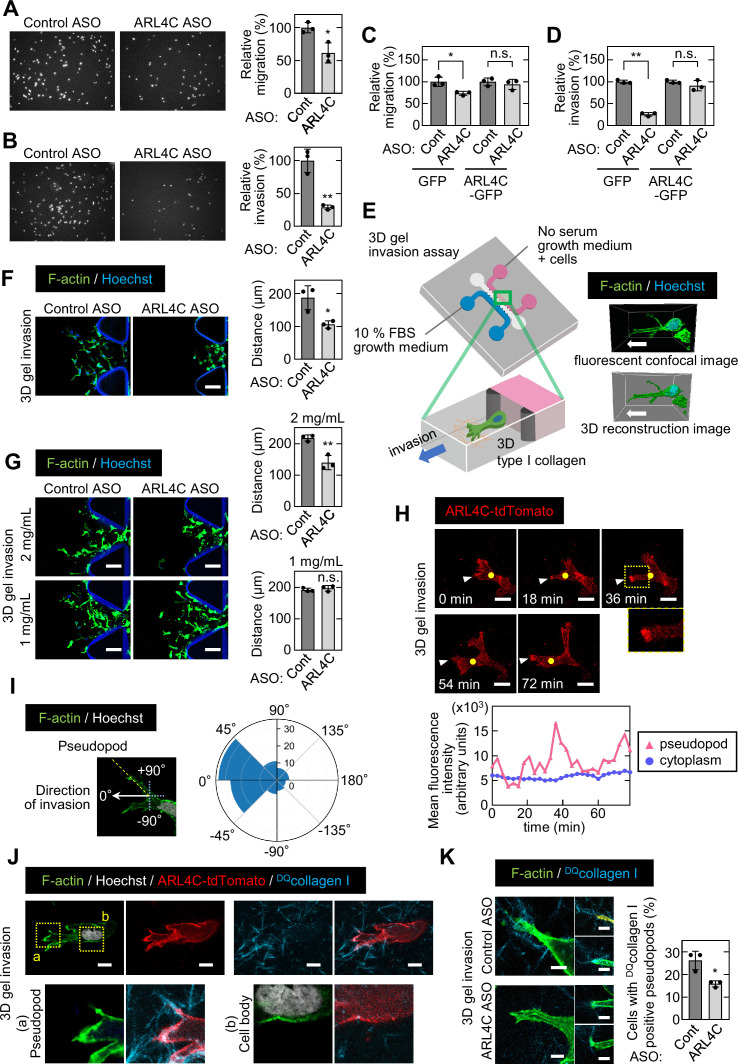
Figure 2. ARL4C expression is especially involved in the invasion of pancreatic cancer cells.
(A-D) S2-CP8 cells (A,B) or S2-CP8 cells expressing GFP or ARL4C-GFP (C,D) were transfected with control or ARL4C ASO-1316 and subjected to migration (A,C) and invasion (B,D) assays. Migratory and invasive abilities are expressed as the percentage of the same cells transfected with control ASO. (E) A schematic illustration of 3D invasion into collagen I gel using a 3D cell culture chip is shown. There is a chemical concentration gradient across the gel channel and cells can invade into the gel. The right panel shows a fluorescent confocal image (top) and a 3D reconstructed image (bottom). (F) S2-CP8 cells were transfected with control or ARL4C ASO-1316 and subjected to a 3D collagen I gel (2 mg/mL) invasion assay. The distances from the edge of the gel interface of all cells invading into the collagen gel were measured. (G) The same assay as in (F) was performed in the presence of different concentrations of collagen I. (H) S2-CP8 cells stably expressing ARL4C-tdTomato were observed with time-lapse imaging. Arrowheads indicate the tips of invasive pseudopods and yellow circles indicate the cytoplasm (20 μm away from the tip of pseudopods). The region in the yellow dashed squares is shown enlarged in the bottom image. Fluorescence intensities of the cytoplasm and invasive pseudopods were measured and plotted as a function of time. (I) S2-CP8 cells were subjected to a 3D collagen I gel invasion assay and stained with phalloidin and Hoechst 33342. The angle of pseudopods to the direction of cell invasion toward FBS was calculated (n = 105). The results were plotted to a polar histogram. (J) S2-CP8 cells expressing ARL4C-tdTomato were subjected to a 3D collagen I gel invasion assay with DQcollagen I, and stained with phalloidin and Hoechst 33342. The regions in the yellow dashed squares (a, pseudopod; b, cell body) are enlarged. (K) S2-CP8 cells transfected with control ASO or ARL4C ASO-1316 were subjected to a 3D collagen I gel invasion assay with DQcollagen I. The percentages of cells with DQcollagen I-positive pseudopods compared with the total number of cells were calculated. (A–D,F,G,K) Data are shown as the mean ± s.d. of three biological replicates. p Values were calculated using a two-tailed Student’s t-test. Scale bars in (F,G) 100 μm; (H) 20 µm; (J) 10 µm; (K) 5 µm. n.s. not significant. *, p < 0.05; **, p < 0.01. See Figure 2—source data 1.


