. 2021 Sep 30;10:e66721. doi: 10.7554/eLife.66721

Figure 3. IQGAP1 is a novel ARL4C-interacting protein.

(A) The ARL4C-interacting proteins in X293T cells were analyzed by mass spectrometry. The results are listed in Supplementary file 1 table 2 and Source data 2. Arrowheads indicate the identified proteins, including IQGAP1 (red). (B,C) Lysates of S2-CP8 cells expressing ARL4C-GFP (B) or S2-CP8 WT cells (C) were immunoprecipitated with anti-GFP antibody (B) or anti-ARL4C antibody (C), and the immunoprecipitates were probed with the indicated antibodies. (D) Lysates of X293T cells expressing the indicated proteins were immunoprecipitated with anti-GFP antibody, and the immunoprecipitates were probed with the indicated antibodies. (E) S2-CP8 cells were stained with the indicated antibodies. Images of ARL4C and IQGAP1 were merged. (F) S2-CP8 cells expressing ARL4C-tdTomato were subjected to a 3D collagen I gel invasion assay and were stained with the indicated antibodies. Images of ARL4C and IQGAP1 were merged. (G,H) S2-CP8 cells expressing GFP or GFP-IQGAP1 were transfected with the indicated siRNAs and subjected to migration (G) and invasion (H) assays. Migratory and invasive abilities are expressed as the percentage of the same cells transfected with control siRNA. (I) S2-CP8 cells depleted of the indicated proteins were subjected to an invasion assay. Invasive activities are expressed as the percentage of control cells. (J) PDAC tissues were stained with anti-IQGAP1 antibody and hematoxylin. (K) The relationship between overall survival and IQGAP1 expression in PDAC patients was analyzed. (L) Scatter plot showing the correlation between the mRNA expression levels of ARL4C (X-axis) and IQGAP1 (Y-axis) in pancreatic cancer patients obtained from TCGA datasets using the R2: Genomics Analysis and Visualization Platform. r indicates the Pearson’s correlation coefficient. (G-I) Data are shown as the mean ± s.d. of three biological replicates. p Values were calculated using a two-tailed Student’s t-test (G,H) or one-way ANOVA followed by Bonferroni post hoc test (I). (K) The data were analyzed by Kaplan–Meier survival curves, and a log-rank test was used for statistical analysis. (E,F) The regions in the yellow dashed squares are shown enlarged in the left bottom images. The right bottom images are shown with a false color representation of fluorescence intensity. More than 50 cells were imaged and the representative image is shown. False color representations were color-coded on the spectrum. Scale bars in (E) 10 μm; (F) 20 μm; (J) 50 µm. KD, knockdown. RFI, relative fluorescence intensity. n.s., not significant. *, p < 0.05; **, p < 0.01. See Figure 3—source data 1.

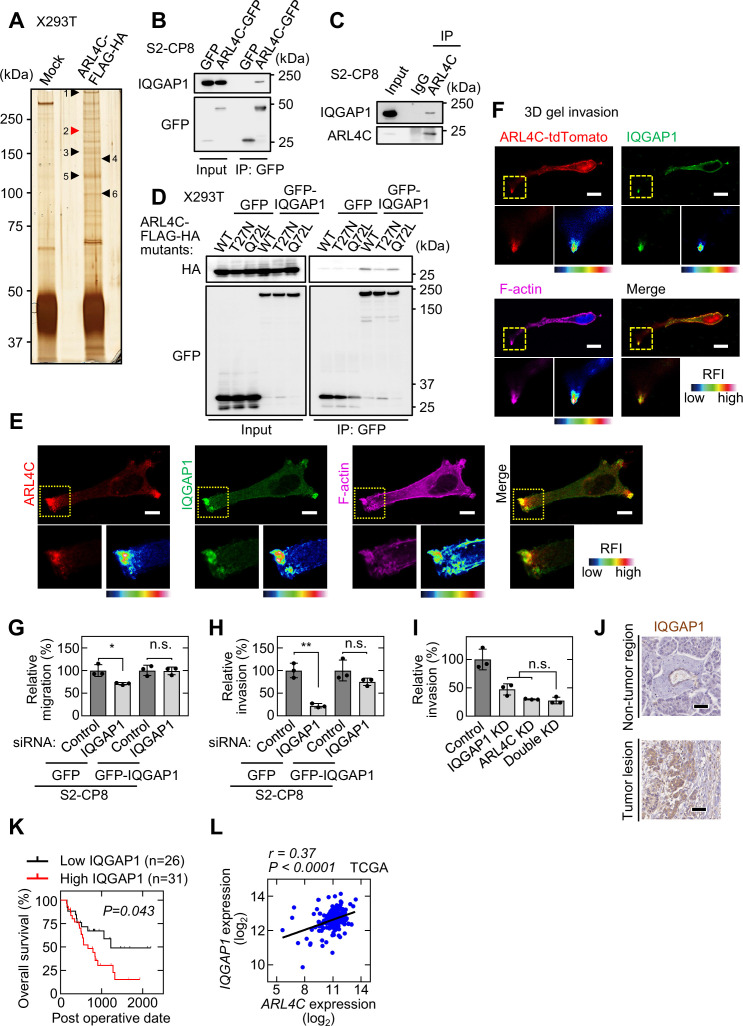
Figure 3—source data 1. Excel file containing quantitative data for Figure 3.

Figure 3.

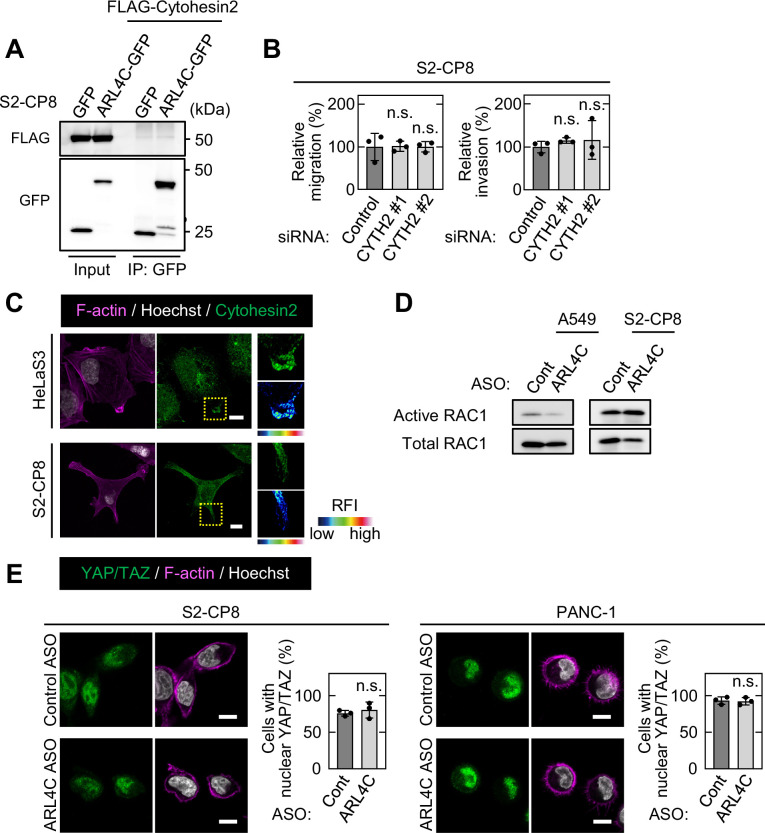
Figure 3—figure supplement 1. Cytohesin2 does not mediate ARL4C signaling in pancreatic cancer cells.

Figure 3—figure supplement 1.

(A) FLAG-cytohesin2 was expressed in S2-CP8 cells expressing GFP or ARL4C-GFP. Lysates were immunoprecipitated with anti-GFP antibody, and the immunoprecipitates were probed with the indicated antibodies. (B) S2-CP8 cells transfected with control or two independent CYTH2 (a gene of cytohesin2) siRNAs were subjected to migration and invasion assays. Migratory and invasive abilities are expressed as the percentage of control cells. (C) HeLaS3 and S2-CP8 cells were stained with anti-cytohesin2 antibody, phalloidin, and Hoechst 33342. Enlarged images (right top) of the regions in the yellow dashed squares are shown in a false color representation of fluorescence intensity (right bottom). False color representations were color-coded on the spectrum. (D) A549 and S2-CP8 cells transfected with the indicated ASOs were subjected to assay for RAC1 activity. (E) S2-CP8 and PANC-1 cells transfected with the indicated ASOs were cultured for 2.5 hr under 2.5D Matrigel conditions and stained with anti-YAP/TAZ antibody and Hoechst 33342. Cells with nuclear YAP/TAZ were counted, and the data are shown as the percentage of positively stained cells compared with the total number of Hoechst-stained cells. (B,E) Data are shown as the mean ± s.d. of three biological replicates. p Values were calculated using a two-tailed Student’s t-test (E) or one-way ANOVA followed by Bonferroni post hoc test (B). Scale bars in (C,E) 10 μm. OE, overexpression. RFI, relative fluorescence intensity. n.s., not significant. See Figure 3—figure supplement 1—source data 1.
Figure 3—figure supplement 1—source data 1. Excel file containing quantitative data for Figure 3—figure supplement 1.
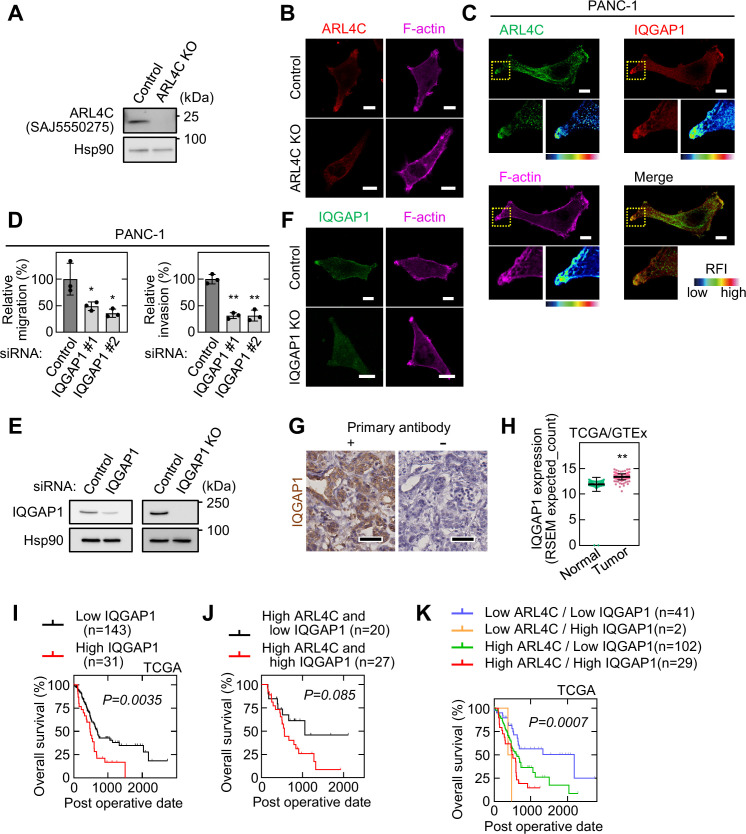
Figure 3—figure supplement 2. IQGAP1 interacts with ARL4C and involves in the invasion of pancreatic cancer cells.

Figure 3—figure supplement 2.

(A) Lysates from S2-CP8 WT or ARL4C KO cells were probed with the indicated antibodies. (B) S2-CP8 WT or ARL4C KO cells were stained with anti-ARL4C antibody and phalloidin. (C) PANC-1 cells were stained with the indicated antibodies. Images of ARL4C and IQGAP1 were merged. Enlarged images of the regions in the yellow dashed squares are shown in a false color representation of fluorescence intensity on the bottom right. False color representations were color-coded on the spectrum. (D) PANC-1 cells transfected with control or IQGAP1 siRNAs were subjected to migration and invasion assays. Migratory and invasive abilities are expressed as the percentage of control cells. Data are shown as the mean ± s.d. of three biological replicates. p Values were calculated using one-way ANOVA followed by Bonferroni post hoc test. (E) Lysates were prepared from S2-CP8 cells transfected with control or IQGAP1 siRNA, and S2-CP8 WT or IQGAP1 KO cells. Lysates were probed with the indicated antibodies. (F) S2-CP8 WT or IQGAP1 KO cells were stained with anti-IQGAP1 antibody and phalloidin. (G) PDAC tissues were stained with or without anti-IQGAP1 antibody as the primary antibody and hematoxylin. (H) IQGAP1 mRNA levels in pancreatic adenocarcinoma and normal tissues of the pancreas were analyzed using TCGA and GTEx datasets. The results are shown as scatter plots with the mean ± s.e.m. p Values were calculated using a two-tailed Student’s t-test. (I) TCGA RNA sequencing and clinical outcome data for pancreatic cancer were analyzed. (J), The relationship between overall survival and IQGAP1 expression in PDAC patients with high ARL4C expression was analyzed. (K) The relationship between ARL4C and IQGAP1 expression on patient survival using TCGA dataset was analyzed. (I–K) The data were analyzed by Kaplan–Meier survival curves, and a log-rank test (I,J) or log-rank trend test (K). Scale bars in (B,C,F) 10 μm; (G) 50 μm. KO, knockout. RFI, relative fluorescence intensity. *, p < 0.05; **, p < 0.01. See Figure 3—figure supplement 2—source data 1.
Figure 3—figure supplement 2—source data 1. Excel file containing quantitative data for Figure 3—figure supplement 2.