. 2021 Sep 30;10:e66721. doi: 10.7554/eLife.66721

Figure 6. ARL4C is involved in focal delivery of MMP14 to invasive pseudopods through IQGAP1.

(A) S2-CP8 cells expressing MMP14-GFP and ARL4C-FLAG-HA were stained with anti-MMP14 without permeabilization, followed by permeabilization and staining with anti-HA and anti-IQGAP1 antibodies. (B) S2-CP8 WT or ARL4C KO cells expressing MMP14-GFP and the indicated mutants of ARL4C-FLAG-HA were stained with anti-MMP14 without permeabilization. The percentages of cells with MMP14 accumulated at invasive pseudopods compared with the total number of cells were calculated. (C) The same assay as in (B) was performed except with S2-CP8 WT or IQGAP1 KO cells expressing MMP14-GFP and FLAG-HA-IQGAP1. (D) S2-CP8 cells expressing MMP14-GFP, FRB-CFP, and mRFP-FKBP-5-ptase domain were treated with 100 nM rapamycin or 50 µM LY294002 for 30 min. Staining and quantification were performed as in (B). (E) S2-CP8 cells depleted of the indicated proteins were subjected to an invasion assay. Invasive activities are expressed as the percentage of control cells. (F–H) S2-CP8 cells (F,G) or S2-CP8 cells expressing MMP14-mCherry or MMP14ΔC-mCherry (H) depleted of the indicated proteins were subjected to a 3D collagen I gel invasion assay with DQcollagen I. The distances from the edge of the gel interface of all cells that invaded into the gel were measured (F,H). The percentages of cells with DQcollagen I-positive pseudopods compared with the total number of cells were calculated (G). (I) PDAC tissues were stained with the indicated antibodies and hematoxylin. The regions in the black dashed squares are shown enlarged in the solid squares. Nine patient samples were imaged and the representative images are shown. (A–D) The regions in the yellow dashed squares are shown enlarged in left bottom and a false color representation of fluorescence intensity is shown in right bottom. False color representations were color-coded on the spectrum. (B–H) Data are shown as the mean ± s.d. of three biological replicates. p Values were calculated using a two-tailed Student’s t-test (H) or one-way ANOVA followed by Bonferroni post hoc test (B–G). Scale bars in (A–D) 10 μm; (F,H) 100 µm; (G) 5 µm; (I) 100 µm. KO, knockout; KD, knockdown. RFI, relative fluorescence intensity. n.s., not significant. *, p < 0.05; **, p < 0.01. See Figure 6—source data 1.

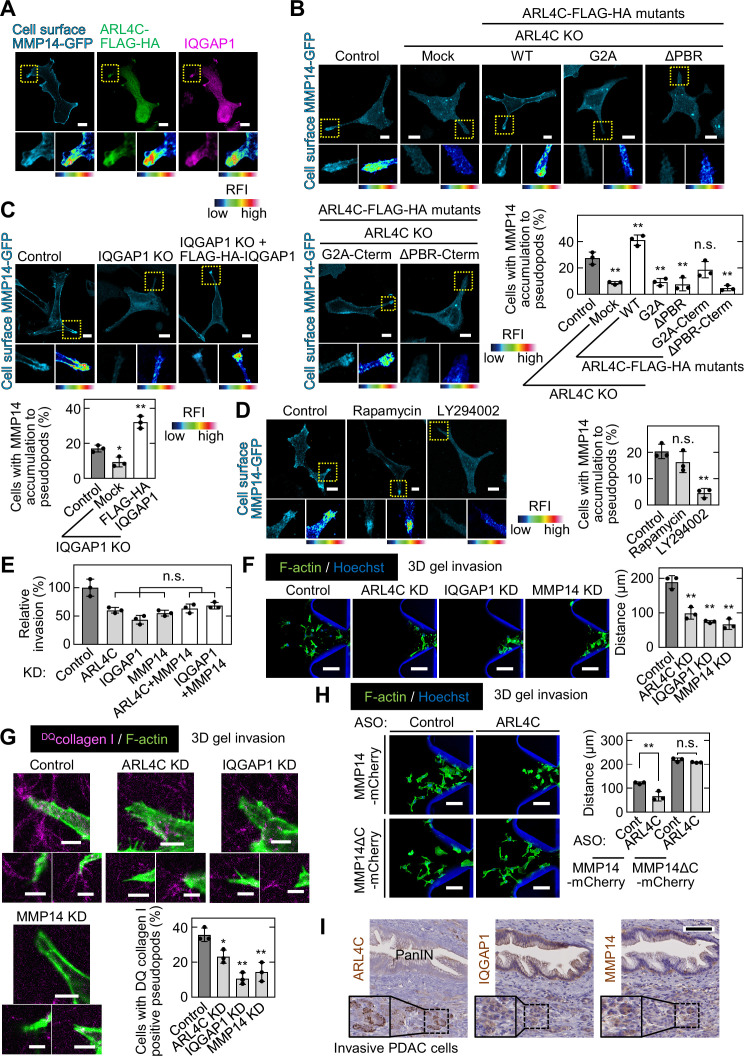
Figure 6—source data 1. Excel file containing quantitative data for Figure 6.

Figure 6.

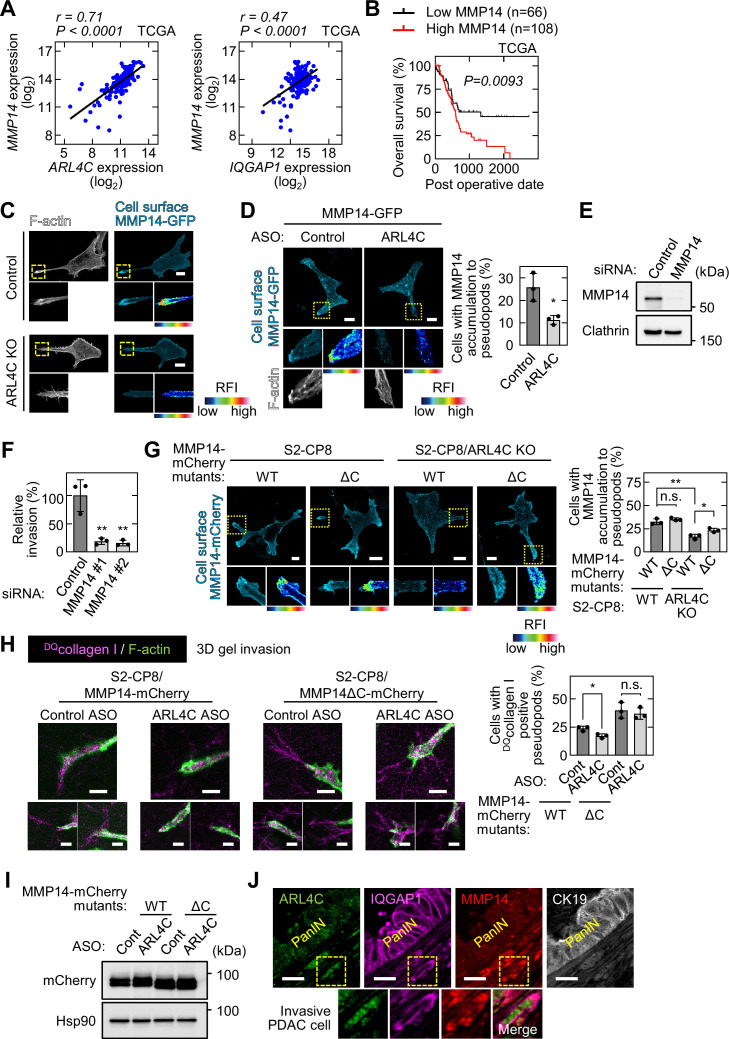
Figure 6—figure supplement 1. ARL4C recruits MMP14 to invasive pseudopods and their expression is associated with poor prognosis in pancreatic cancer patients.

Figure 6—figure supplement 1.

(A) Scatter plot showing the correlation between the mRNA expression levels of ARL4C or IQGAP1 (X-axis) and MMP14 (Y-axis) in pancreatic cancer patients obtained from TCGA datasets using the R2: Genomics Analysis and Visualization Platform. r indicates the Pearson’s correlation coefficient. (B) TCGA RNA sequencing and clinical outcome data for pancreatic cancer were analyzed. The data were analyzed by Kaplan–Meier survival curves, and a log-rank test was used for statistical analysis. (C) S2-CP8 WT or ARL4C KO cells expressing MMP14-GFP were stained with anti-MMP14 antibody without permeabilization and then labeled with phalloidin. (D) S2-CP8 WT cells expressing MMP14-GFP were transfected with control ASO or ARL4C ASO-1316. Cells were stained with anti-MMP14 antibody without permeabilization and then labeled with phalloidin. The percentages of cells with MMP14 accumulated at invasive pseudopods compared with the total number of cells were calculated. (E) Lysates of S2-CP8 cells transfected with control or MMP14 siRNA were probed with anti-MMP14 and anti-Clathrin antibodies. (F) S2-CP8 cells transfected with control or MMP14 siRNAs were subjected to invasion assay. Invasive abilities are expressed as the percentage of control cells. (G) S2-CP8 cells or ARL4C KO S2-CP8 cells expressing MMP14-mCherry or MMP14ΔC-mCherry were stained with anti-MMP14 antibody without permeabilization. The percentages of cells with MMP14 accumulated at invasive pseudopods compared with the total number of cells were calculated. (H) S2-CP8 cells stably expressing MMP14-mCherry and MMP14ΔC-mCherry were transfected with control or ARL4C ASO-1316 and were then subjected to a 3D collagen I gel invasion assay with DQcollagen I. The cells were stained with phalloidin. Three representative images for each condition are shown. Percentages of cells with DQcollagen I-positive pseudopods compared with the total number of cells were calculated. (I) S2-CP8 cells stably expressing MMP14-mCherry and MMP14ΔC-mCherry were transfected with control or ARL4C ASO-1316. Lysates were probed with the indicated antibodies. (J) PDAC tissues were stained with the indicated antibodies. The regions in the yellow dashed squares are shown enlarged in the bottom. Images of ARL4C, IQGAP1, and MMP14 were merged as the right bottom panel shows. Nine patient samples were imaged and the representative images are shown. (D,F-H) Data are shown as the mean ± s.d. of three biological replicates. p Values were calculated using a two-tailed Student’s t-test (D,H) or one-way ANOVA followed by Bonferroni post hoc test (F,G). (C,D,G) The regions in the yellow dashed squares are shown enlarged in the left bottom images. The right bottom images are shown in a false color representation of fluorescence intensity. False color representations were color-coded on the spectrum. Scale bars in (C,D,G,H) 10 μm; (J) 20 μm. KO, knockout. RFI, relative fluorescence intensity. n.s., not significant. *, p < 0.05; **, p < 0.01. See Figure 6—figure supplement 1—source data 1.
Figure 6—figure supplement 1—source data 1. Excel file containing quantitative data for Figure 6—figure supplement 1.