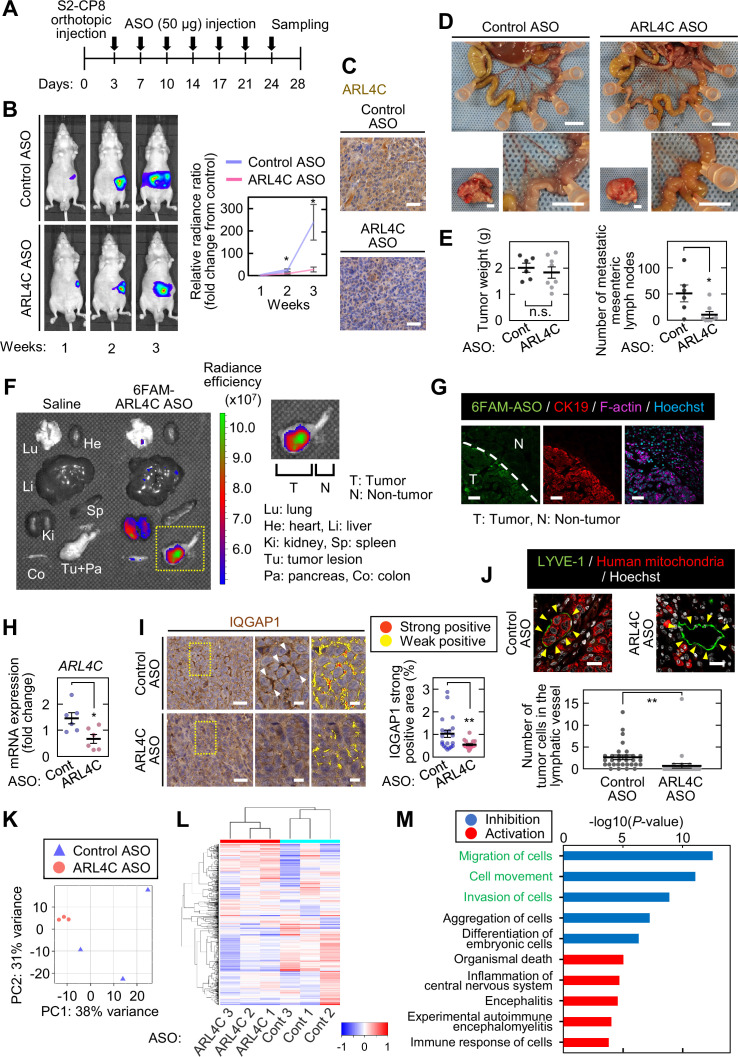
Figure 7. ARL4C ASO inhibits pancreatic tumor metastasis in vivo.
(A) S2-CP8/Luciferase cells were implanted into the pancreas of nude mice, and control ASO (n = 6) or ARL4C ASO-1316 (n = 7) was subcutaneously administered. (B) Bioluminescence images of the intraperitoneal tumors are presented (left) and quantification of the tumor burden is shown (right). The data are presented as the mean ± s.e.m. of the fold change in luminescent intensity relative to that of week 1 treated with control ASO. (C) Sections from the pancreatic tumors from control ASO- or ARL4C ASO-1316-treated tumor-bearing mice were stained with anti-ARL4C antibody and hematoxylin. (D) Representative images of the tumors in the pancreas (left bottom) and metastatic mesenteric lymph nodes (top and right bottom) are shown. (E) Primary tumor weight (left) and metastatic mesenteric lymph node number are presented (right). Data are shown as the mean ± s.e.m. (F,G) Four hr after subcutaneous injection of 6-FAM-ARL4C ASO-1316 into tumor-bearing mice, the fluorescence intensities of various organs were measured (F), and the sections prepared from the pancreas were stained with the indicated antibodies (G). Area indicated by yellow dashed square is enlarged on the right panel (F). (H) Total RNA was extracted from tumors of control ASO- or ARL4C ASO-1316-treated tumor-bearing mice. Tumor block was cut into three pieces from each tumor of 2 mice per group. ARL4C mRNA levels were measured by quantitative real-time PCR. Relative ARL4C mRNA levels were normalized to those of B2M and expressed as fold changes compared with the levels in one of the control samples. (I) Sections from the pancreatic tumors were stained with anti-IQGAP1 antibody and hematoxylin. The two panels on the right show enlarged images of the yellow dashed squares. Positive staining of IQGAP1 is color-coded as yellow (weakly positive) or red (strongly positive). The percentage of the strongly positive IQGAP1 area was calculated. Data are shown as the mean ± s.e.m. Twenty fields were analyzed from 3 mice per group. (J) Sections from the pancreatic tumor were stained with the indicated antibodies. The numbers of tumor cells in the lymphatic vessels (indicated with yellow arrowheads) were counted. Data are shown as the mean ± s.e.m. Thirty lymphatic vessels were analyzed from 3 mice per group. (K,L) RNA sequencing was performed for S2-CP8-derived primary tumors, and the results of principal component analysis (K) and hierarchical clustering (L) are shown. (M) Differentially expressed genes were subjected to Ingenuity Pathway Analysis (IPA). The top five disease or function annotations of the positive and negative Z-score groups are shown. Bars indicate the -log10 (p value). Inhibited pathways are represented by blue-colored bars while activated pathways are shown by red-colored bars. (B,E,H-J) p Values were calculated using a two-tailed Student’s t-test. Scale bars in (D) 5 mm; (C,G,I) 50 µm; (J) 20 µm. n.s., not significant. *, p < 0.05; **, p < 0.01. See Figure 7—source data 1 and Figure 7—source data 2.


