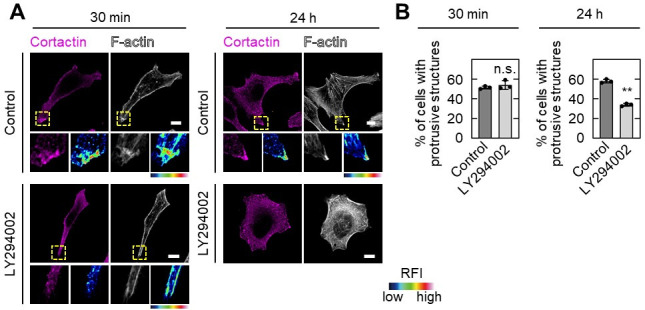
Author response image 3. Effect of LY294002 treatment on pseudopod formation.

A,B, S2-CP8 cells were treated with or without 50 µM LY294002 for 30 min or 24 h before fixation, and stained with the indicated antibodies (A).The percentages of cells with protrusive structures compared with the total number of cells were calculated (B). A, The regions in the yellow dashed squares are shown enlarged in the left bottom images. The right bottom images are shown in a false color representation of fluorescence intensity. False color representations were color-coded on the spectrum. (B), Data are shown as the mean ± s.d. of 3 biological replicates. P values were calculated using a two-tailed Student’s t-test. Scale bars in A, 10 μm. RFI, relative fluorescence intensity. n.s., not significant. **, P < 0.01.
