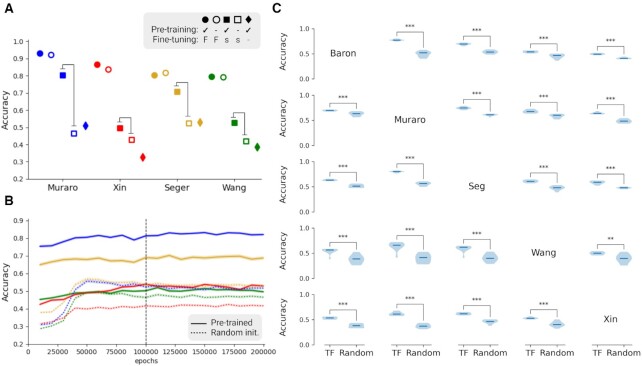
Figure 3.
An accuracy chart of 5way-5shot task with five different single-cell pancreas datasets. (A) Comparisons between different training conditions show that transfer learning makes a significant difference in small-size data conditions. Pre-training refers to pre-training with the GTEx dataset, and it is represented with filled markers. Fine-tuning refers to additional training with the Baron dataset. ‘F’ indicates that the complete dataset of Baron was used for the fine-tuning training step, and it is represented with a circle. ‘s’ indicates a data scarcity condition, and it is represented with a square. ‘-’ indicates no fine-tuning training, and it is represented with a diamond. (B and C) Figures are about the data scarcity condition (filled and hollow square cases). (B) Accuracy chart during training for fine-tuning with subset of the Baron dataset (15 samples per class) in case for two squares in (A). After 50 000 epochs, performance of the model converged. Solid lines represent models based on pre-trained networks with GTEx dataset and further trained with a subset of the Baron dataset. Dotted lines are randomly initialized networks trained with 15 samples per class from the Baron dataset. (C) Pair-wise comparisons of 5 different single-cell pancreas datasets show accuracy differences between pre-trained and randomly initialized networks. Each of the violin plots is composed of 10 repeats of training. ‘TF’ indicates fine-tuning started with pre-trained network and ‘Random’ indicates randomly initialized models. The rows represent the dataset used for fine-tuning, the column the dataset used for testing. Statistical significance evaluated by Student’s t-test is indicated by *P < 0.05, **P < 0.01, ***P < 0.001. Created with BioRender.com.

