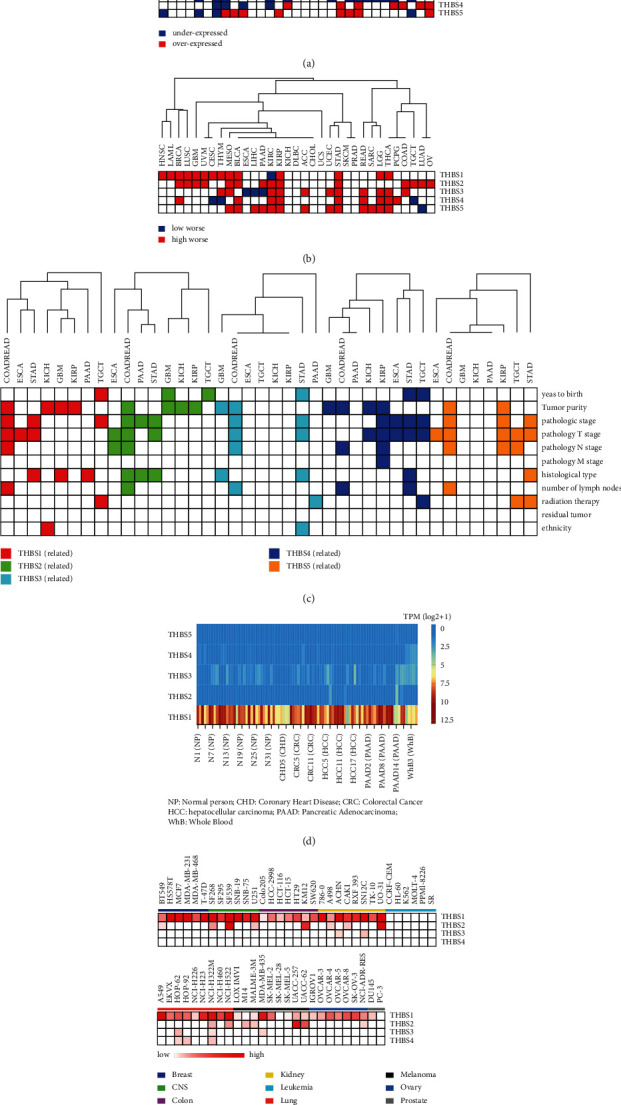
Figure 2.

THBSs' expression and clinical features. (a) Differential expression of THBSs between TCGA cancer and the normal tissues. Blue represents low expression in cancer tissue (p < 0.05), and red indicates high expression in cancer tissue (p < 0.05). (b) Overall survival analysis between high and low expression of THBSs in TCGA cancers. The blue indicates that the survival of patients with THBSs low expression in cancer tissue is shorter (p < 0.05). The red indicates that the survival of patients with THBS high expressions in cancer tissue is worse (p < 0.05). (c) The relationship between THBS expression levels and the clinical parameters in TCGA cancers. The color indicates that clinical parameters were significantly associated with gene expression level (p < 0.05), and the white means the opposite. (d) The heatmap of THBS expressions in blood derived from the indicated patients. (e) The heatmap of THBS1, THBS2, THBS3, and THBS4 as extracellular vesicle proteins detected in 60 cell lines of NCI-60.
