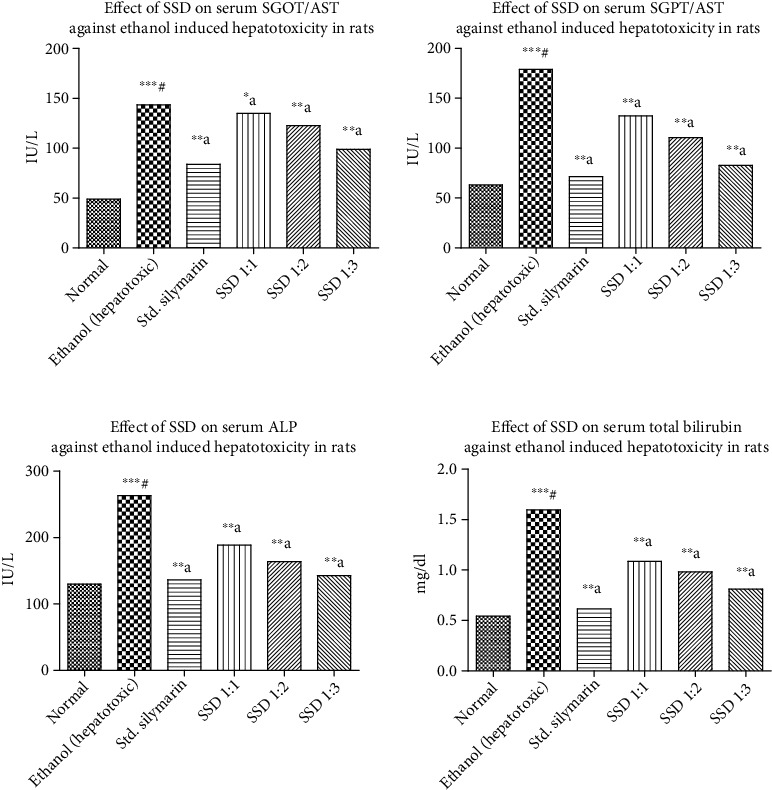
Figure 7.

Ethanol-induced hepatotoxicity assessment of silymarin and prepared SSD: effect on SGOT/AST, effect on SGPT/ALT, effect on ALP, and effect on total bilirubin concentration, respectively. Statistical control: ∗∗∗#p < 0.0001 compared with control by the Student unpaired “t”-test; ∗∗bp < 0.05 compared with ethanol; ∗∗ap < 0.001 compared with ethanol.
