
Figure 2. Pathological response according to HER2 heterogeneity and hormone receptor status.
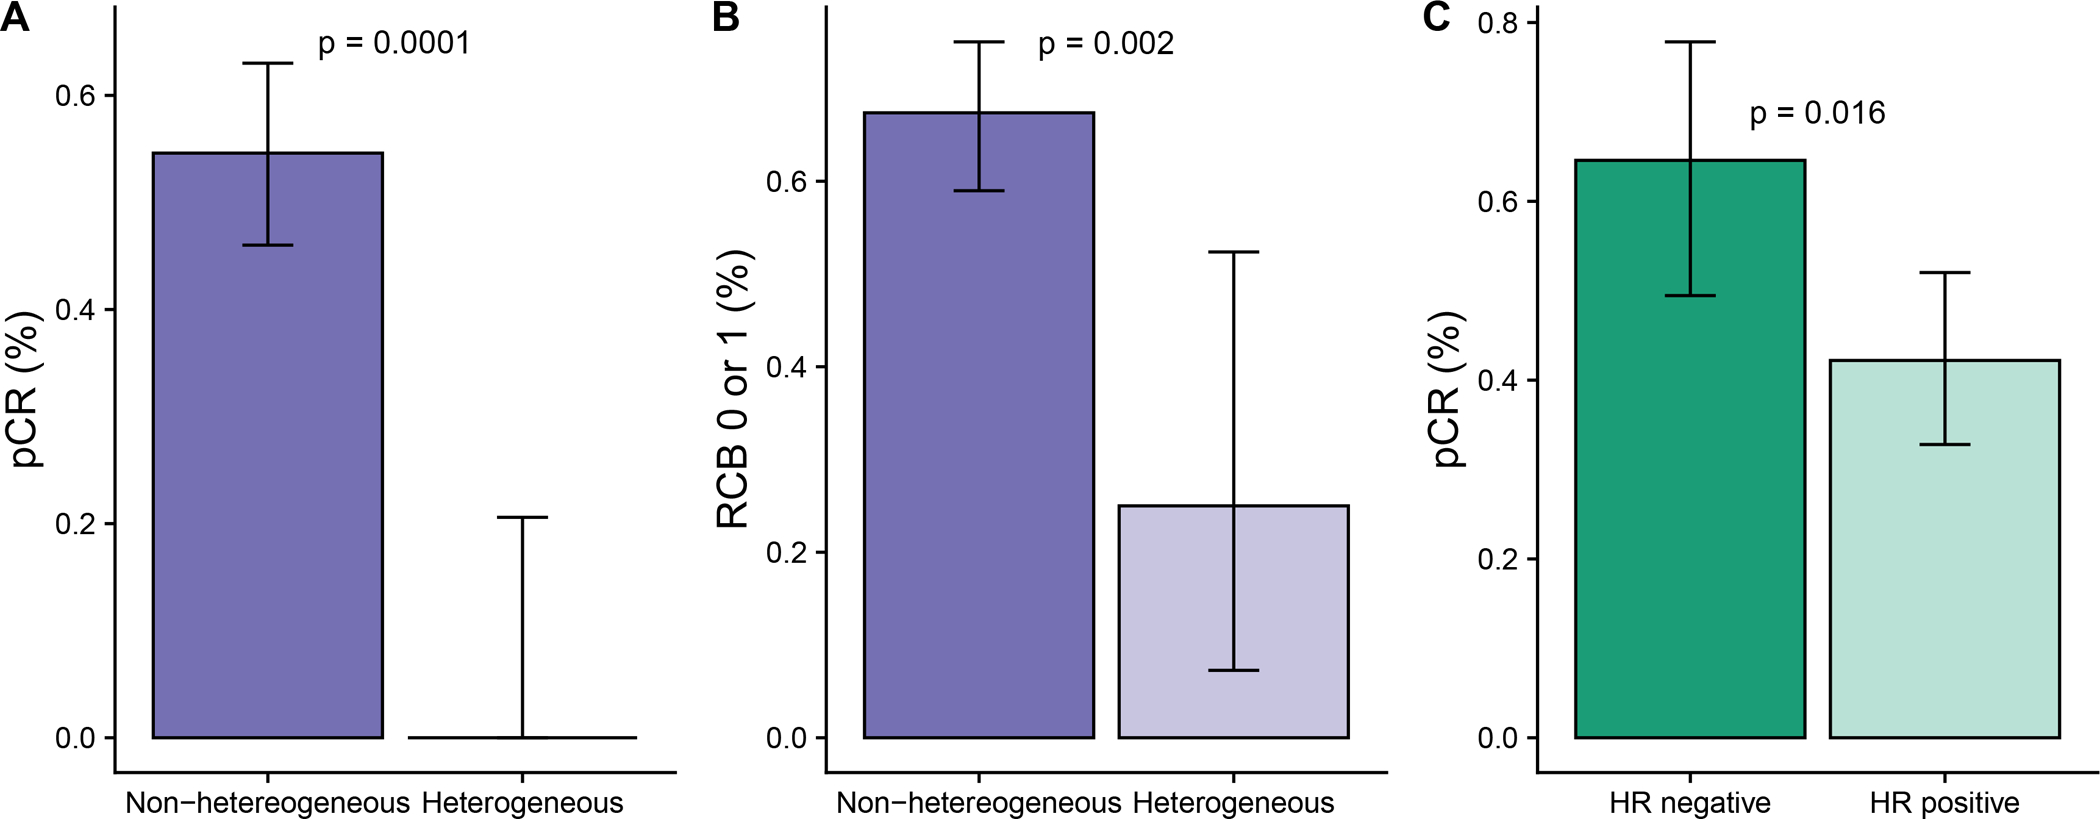
The mean and 95% confidence interval of the mean is shown in each graph. A, pCR by HER2 heterogeneity. B, Pathological response defined as RCB 0 or I by HER2 heterogeneity. C, pCR by hormone receptor (HR) status for the overall study population. A-C, P-values are from a χ2 test.