
Figure 3. Assessment of HER2 heterogeneity at the single cell level.
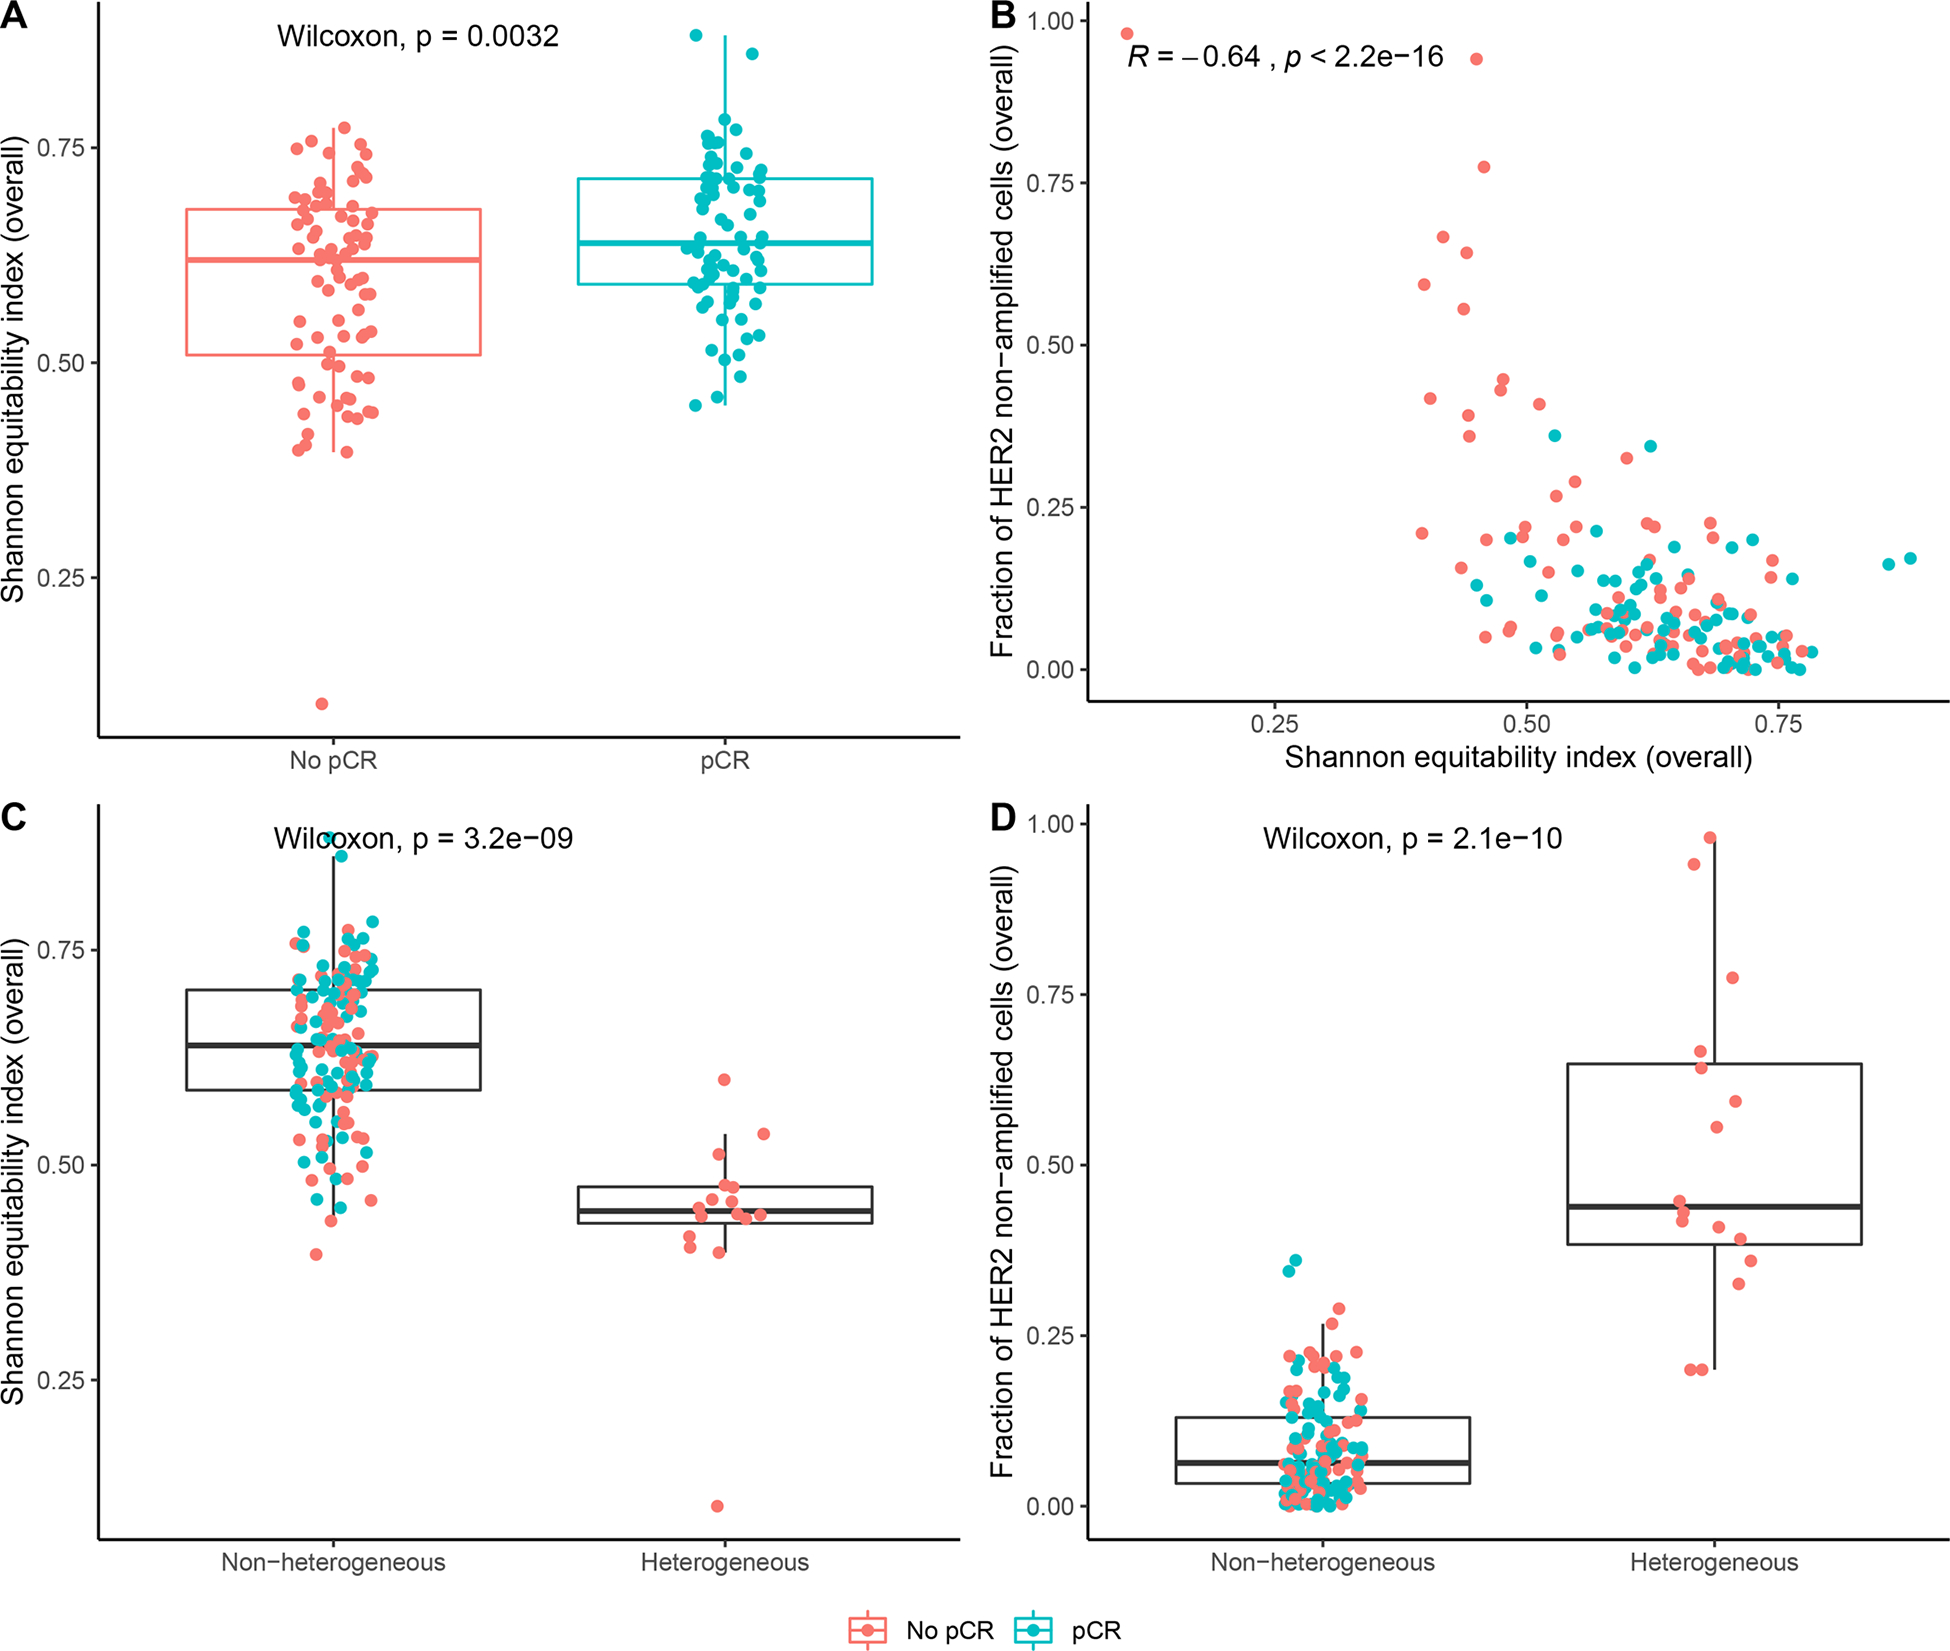
A, Shannon equitability index for each patient, separated by response. P-value is from a Wilcoxon test. B, Shannon equitability index (x-axis) vs. frequency of ERBB2 non-amplified cells. Each datapoint represents one patient. R and p-value are from a Pearson correlation test of association. Red represents non-responders and blue represents responders. C, Shannon equitability index for each patient, separated by central pathology evaluation of HER2 heterogeneity. P-value is from a Wilcoxon test. D, Frequency of ERBB2 non-amplified cells in each patient, separated by central pathology evaluation of HER2 heterogeneity. P-value is from a Wilcoxon test. A, C-D, The lower and upper hinges correspond to the 1st and 3rd quartiles, respectively. The lower and upper whiskers extend to the smallest and largest values, respectively, no further than 1.5*IQR from the hinge, where the IQR is the distance between the 1st and 3rd quartiles. All data points are plotted.