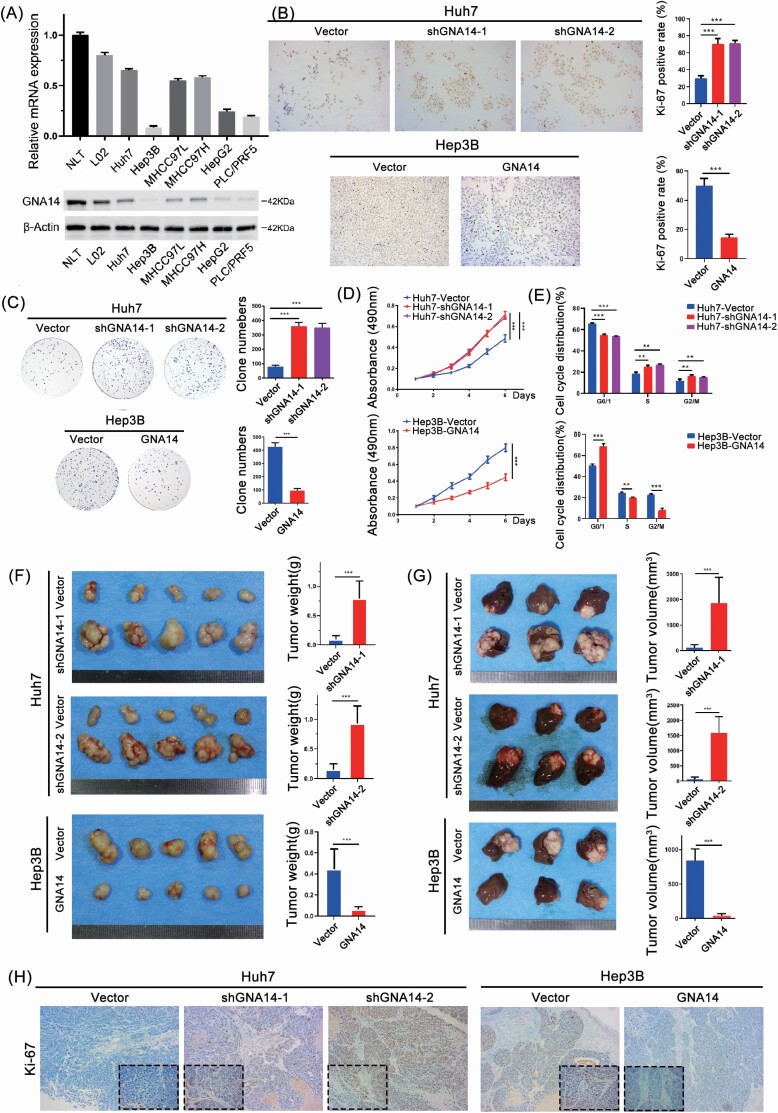
Figure 3.
GNA14 inhibits the growth of liver cancer in vitro and in vivo. (A) GNA14 expression was investigated in normal liver tissues and liver cancer cell lines analyzed by real-time PCR and western blot. (B) Representative images of Ki67 staining in Huh7-shGNA14-1, Huh7-shGNA14-2, Hep3B-GNA14 cell ines and their control cells were shown. The histograms showed the percent of Ki-67 positive rate in each cell lines respectively. (C) The proliferation ability of GNA14-intervened Huh7 and Hep3B cell lines was monitored by colony formation assay. Representative micrographs (left) and quantifications (right) of liver cancer cell colonies in indicated cell lines. (D) MTT analysis of the proliferation ability of Huh7 and Hep3B transfectants. (E) DNA-content staining based cell-cycle analysis in GNA14-intervened Huh7 and Hep3B cell lines. DNA was stained by Propidium iodide. (F) Subcutaneous xenograft tumors from Huh7-shGNA14-1, Huh7-shGNA14-2 and Hep3B-GNA14 cells and their control cells were established in nude mice. Subcutaneous tumors from Huh7-shGNA14-1, Huh7-shGNA14-2 and Hep3B-GNA14 cells and their control cells were removed and shown (left). The histograms showed the weight and statistic analysis of subcutaneous tumors (right). (G) Orthotopic tumors were established using subcutaneous tumors and removed after 6 weeks and each of the indicated groups is shown (left). Tumor volumes of tumors were calculated according to the following equation: V (mm3) = width2 (mm2) × length (mm)/2 and the histograms showed the statistic analysis of orthotopic tumors. ***P < 0.001 based on the Student’s t-test. Error bars, standard deviation. (H) Representative images of Ki67 staining in tissue sections from orthotopic tumors were shown. magnification: 100×, inset magnification: 400×.

