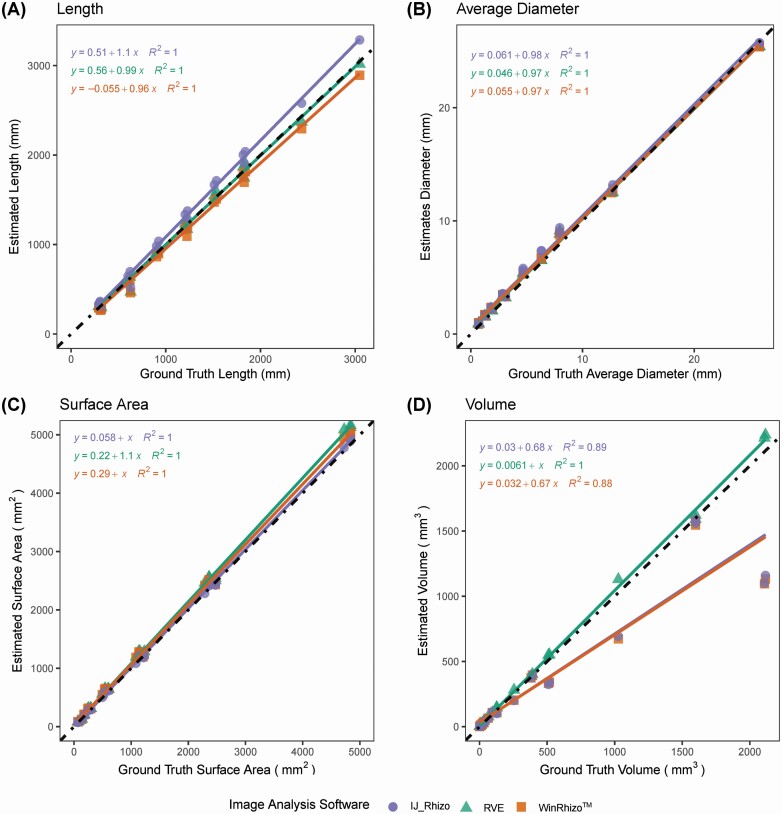
Figure 5.
Comparison of physical measurements (length, average diameter, surface area and volume) of various gauges of copper wires to the trait estimates generated from scanned images acquired at 600 DPI and analysed using IJ_Rhizo, RhizoVision Explorer (RVE) and WinRhizo™, at a threshold value of 191. The fitted regression line for RVE and WinRhizo™ are shown in green and orange, respectively. The dotted black line represents a 1:1 relationship. A, B, C and D show length, average diameter, surface area and volume, respectively.

