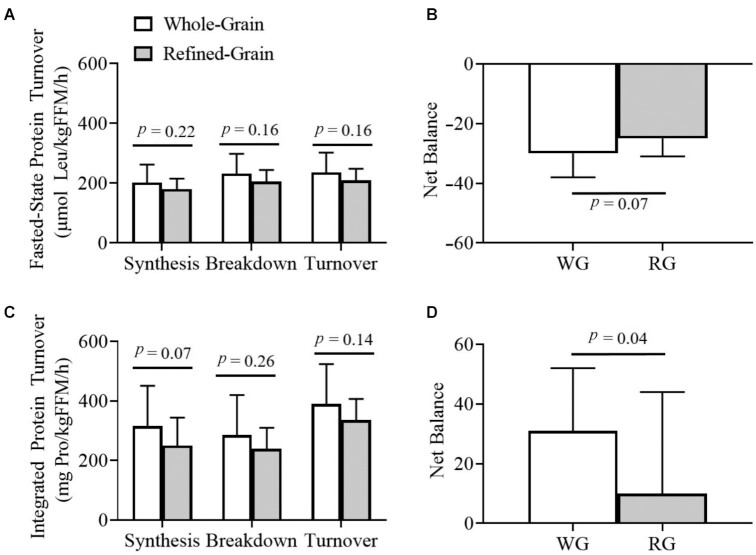
FIGURE 1.
Fasted-state and integrated whole-body protein turnover. (A) Fasted-state leucine kinetics revealed greater turnover (WG: 235.1 ± 66.2 µM Leu/kgFFM/h; RG: 209.2 ± 39.4 µM Leu/kgFFM/h, P = 0.16, n = 14), synthesis (WG: 202.1 ± 59.8 µM Leu/kgFFM/h; RG: 179.9 ± 35.2 µM Leu/kgFFM/h, P = 0.22, n = 14), and breakdown (WG: 231.8 ± 66.2 µM Leu/kgFFM/h; RG: 205.1 ± 39.4 µM Leu/kgFFM/h, P = 0.16, n = 14) on a whole-grain diet, although these did not reach statistical significance. (B) This resulted in a trend for a more negative net protein balance on the WG diet (WG: −29.7 ± 7.8 µM Leu/kgFFM/h; RG: −25.2 ± 5.7 µM Leu/kgFFM/h, P = 0.07, n = 14). (C) Integrated glycine kinetics revealed a similar pattern for turnover (WG: 390.4 ± 134.0 mg Pro/kgFFM/h; RG: 336.4 ± 70.1 mg Pro/kgFFM/h, P = 0.14), synthesis (WG: 315.6 ± 134.7 mg Pro/kgFFM/h; RG: 249.5 ± 93.8, P = 0.07, n = 11), and breakdown (WG: 284.5 ± 135.5 mg Pro/kgFFM/h; RG: 239.3 ± 71.5 mg Pro/kgFFM/h, P = 0.26, n = 11), again not reaching statistical significance. (D) This resulted in a substantially more positive net protein balance on the WG diet (WG: 31.1 ± 21.5 mg Pro/kgFFM/h; RG: 10.3 ± 34.3 mg Pro/kgFFM/h, P = 0.04, n = 11). Data from 3 participants were not available for integrated protein synthesis. Net Balance denotes net protein balance determined by subtracting protein breakdown from protein synthesis rates. This figure represents data obtained after consuming each diet for 8 weeks. Data are presented as mean ± SD. P values were obtained from ANOVA with linear mixed model effects and were adjusted for period, age, sex, race, and body weight change. kgFFM, kilograms fat-free mass; Leu, leucine; Pro, protein; RG, refined-grain; WG, whole-grain.

