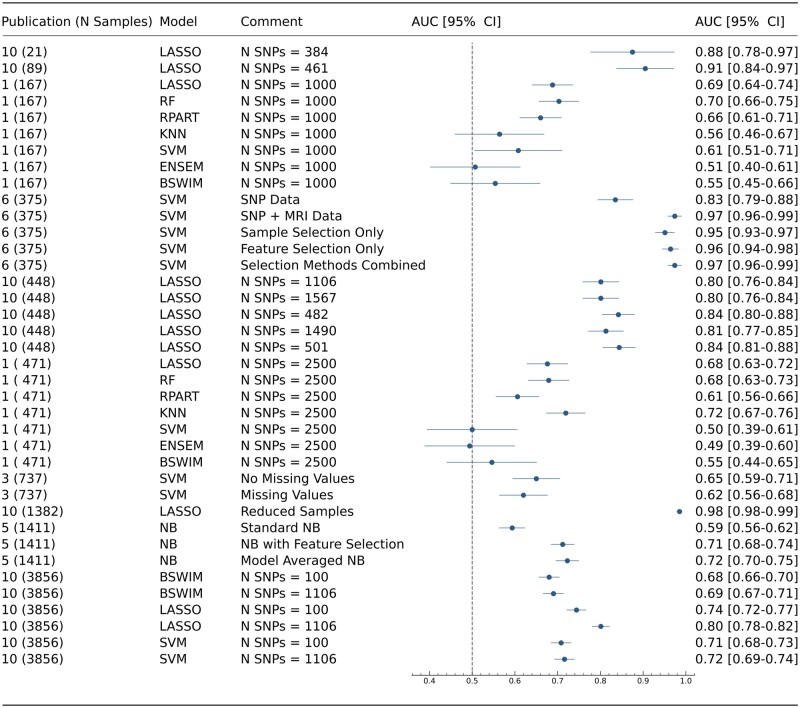
Figure 2.
A forest plot displaying models used across publications which reported AUC, with the addition of confidence intervals derive using the Newcombe Method. Column 1—Publication number as found in Supplementary Table 1, along with sample size. Column 2—Type of machine learning model. Column 3—Information to help distinguish between models in publications, including differing SNP numbers and methodologies.

