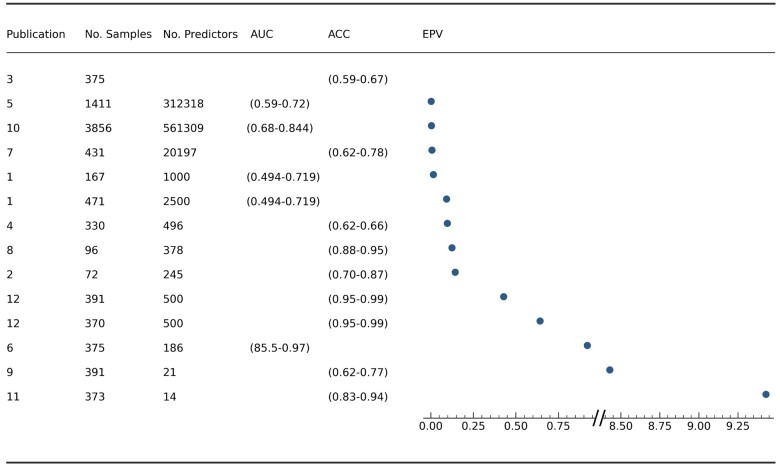
Figure 4.
A forest plot displaying all available EPV values across the included studies. Column 1—Publication number as found in Supplementary Table 1. Column 2—Number of samples. Column 3—Number of predictors used, Column 4—AUC of models if reported, Column 5—ACC of models if reported, Column 6—values of EPV.

