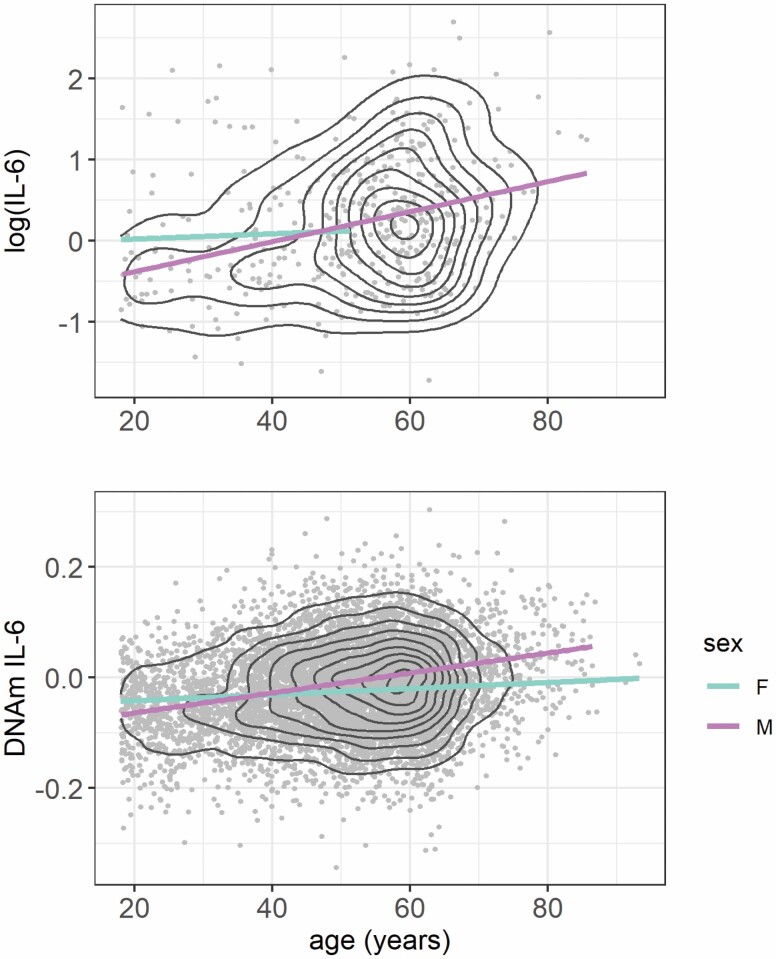
Figure 2.
Plots of log(IL-6) (n = 417) and DNAm IL-6 score (N = 7028) with chronological age in Generation Scotland. The measured IL-6 samples had previously been selected as father/offspring pairs limiting the number of samples from older females in the dataset. Gray dots represent individual participant measurements with regression lines shown for females and males in purple and blue, respectively. Black lines represent density.

