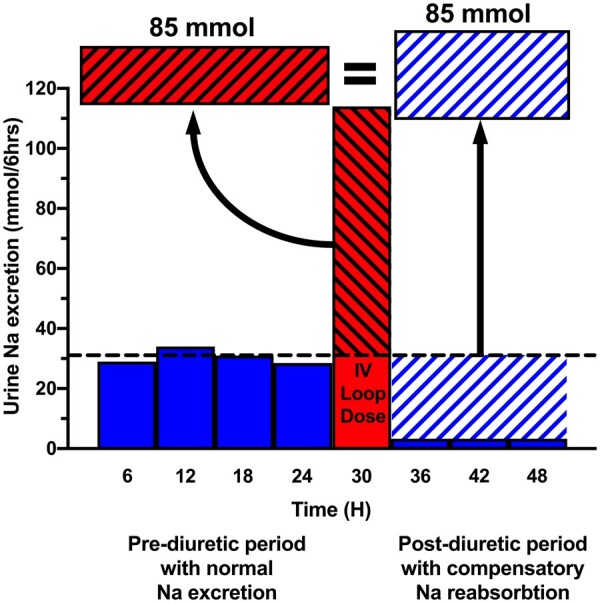
Figure 1.

Concept of compensatory post-diuretic sodium reabsorption. The concept of compensatory post-diuretic sodium reabsorption is illustrated by graphing hypothetical urinary sodium excretion over a 48-h period divided into 6-h blocks. A 24-h pre-diuretic period (blue bars) is followed by a 6-h natriuretic period from an IV loop diuretic dose in the red bar and subsequent 18-h post-diuretic period (blue bars). The horizontal dotted black line denotes the average rate of urinary sodium excretion needed every 6 h (31 mmol/6 h) to achieve a net even 24-h sodium balance, where dietary sodium intake (130 mmol) equals urinary sodium excretion (95% of intake = 124 mmol) plus insensible sodium losses (6 mmol). In the pre-diuretic period, the urinary sodium excretion rate equals the sodium intake. The diagonally hashed portion of the red LD bar above the dotted line represents the quantity of natriuresis exceeding the expected rate from dietary intake. In the post-diuretic period, the diagonally hashed blue space indicates the amount of post-diuretic sodium reabsorption, where urinary sodium excretion is depressed following a diuretic period. The concept of compensatory post-diuretic sodium reabsorption asserts the red diagonally hashed area of excess natriuresis will trigger a compensatory post-diuretic sodium reabsorption of equal magnitude, resulting in a net even sodium balance.
