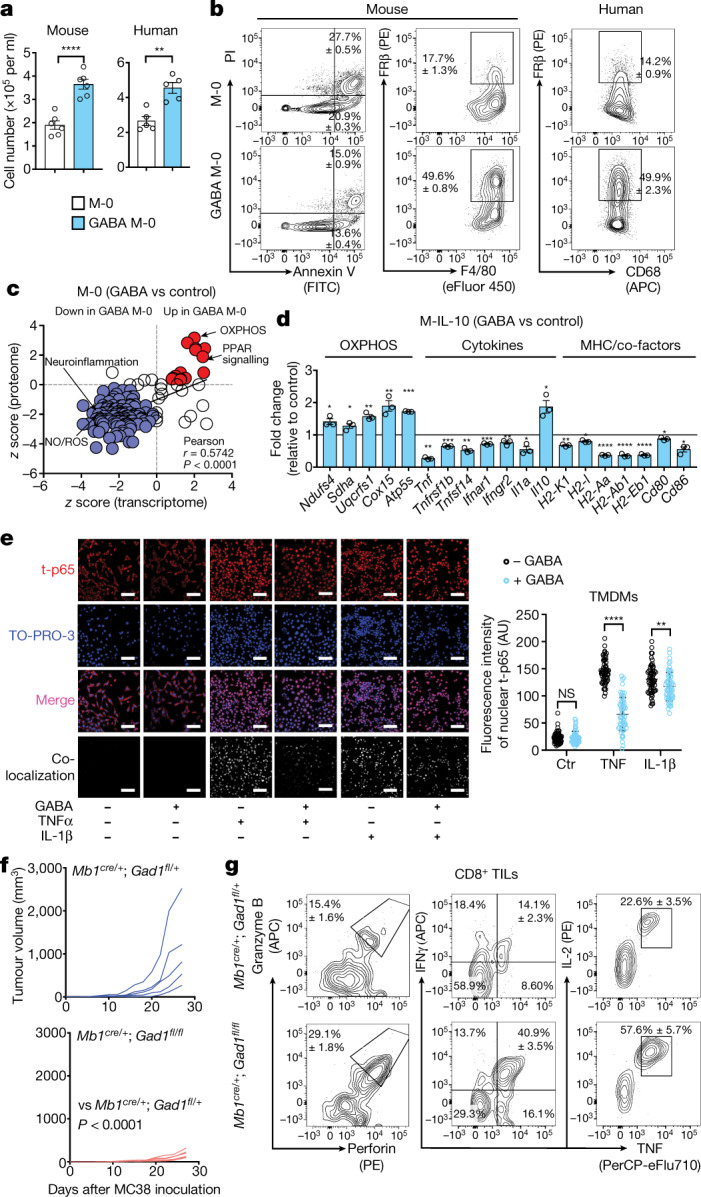
Fig. 4. B cell-derived GABA differentiates anti-inflammatory macrophages, promoting tumour growth.

a, Quantification of mouse bone marrow or human monocytes cultured in the presence of macrophage colony-stimulating factor (M-CSF) for 6 d (mouse, n = 6) or 7 d (human, n = 5) with (GABA M-0) or without (M-0) 1 mM GABA. b, Flow cytometry of GABA M-0 and M-0 cell viability (assessed with propidium iodide (PI) and Annexin V, n = 4), F4/80, CD68 and FRβ (mouse, n = 3; human, n = 5)). c, Pathway analysis of mouse GABA M-0 and M-0 transcriptomes (n = 2) and proteomes (n = 3) (red, upregulated (>0); purple, downregulated (<0)). d, Gene expression of mouse M-0 and GABA M-0 cells after 6 h of treatment with IL-10 (M-IL-10 and GABA M-IL-10) (n = 3). e, Day 7 MC38 tumour monocytes differentiated in vitro into tumour monocyte-derived macrophages (TMDMs) with or without treatment with 1 mM GABA. Immunocytochemistry shows nuclear (TO-PRO-3) localization of total NF-κB p65 (t-p65) after TNF or IL-1β stimulation. Scale bars, 100 µm (n = 60). AU, arbitrary units. f, MC38 tumour volume in Mb1cre/+;Gad1fl/+ (n = 5) or Mb1cre/+;Gad1fl/fl (n = 6) mice. g, Flow cytometry of intracellular cytokines in CD8+ tumour-infiltrating lymphocytes (TILs) after re-stimulation (Mb1cre/+;Gad1fl/+, n = 4; Mb1cre/+;Gad1fl/fl, n = 5). Significance was calculated by two-tailed unpaired t-test (a, d) or two-way ANOVA (e, f): *P < 0.05, **P < 0.01, ***P < 0.001, ****P < 0.0001; NS, not significant. Data are shown as mean ± s.e.m. n indicates the number of biological (c, d, f, g) or technical (a, b, e) replicates. Data are representative of two (c (proteome)) or three (a (mouse), b (mouse)) experiments. Exact P values are provided in the source data.
