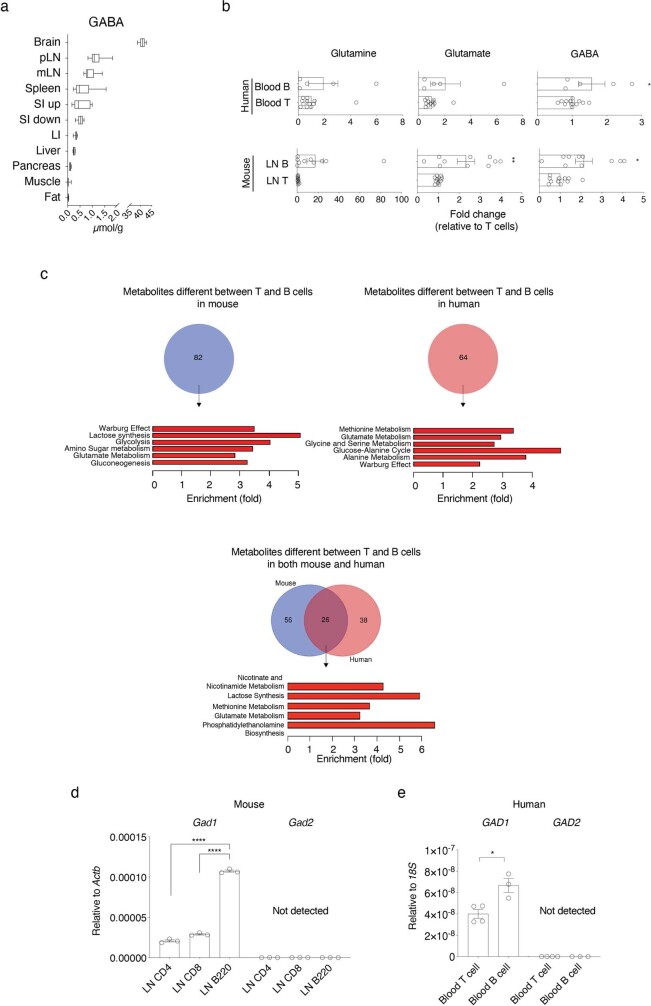
Extended Data Fig. 2. GABA concentration in multiple tissues and metabolic signature of B cells in mouse and human.
a, Quantification of GABA in brain, peripheral lymph nodes (pLN) (n = 6), mesenteric LN (mLN) (n = 6), spleen (n = 6), upper and lower segments of the small intestine (SI up and SI low, respectively) (n = 6), large intestine (LI) (n = 6), liver (n = 6), pancreas (n = 6), hindlimb skeletal muscle (n = 6) and perigonadal fat (n = 5) of WT mice measured by mass spectrometry. Box-and-whiskers plots represent the range from the 25th to 75th percentiles (box), the median value (the middle line) and the minimum to maximum value (whiskers). n indicates biological replicates. b, Measurement of glutamine, glutamate and GABA by mass spectrometry in ex vivo-sorted T or B cells purified by FACS from mouse peripheral lymph nodes and human peripheral blood, relative to matched T cells. c, Venn diagrams (upper) and metabolite-set–enrichment analysis (lower panels) showing the significantly different metabolites (two-tailed unpaired t-test P value < 0.05) between ex vivo-sorted T and B cells from mice or humans (n = 5 (B cells) or 12 (T cells) replicates derived from 5 biologically independent human healthy donors, n = 10 or 11(glutamate and GABA in T cells) replicates derived from 6 biologically independent mice). d, e, qPCR analysis of GAD67 (Gad1/GAD1) and GAD65 (Gad2/GAD2) mRNA level in mouse LN-derived T and B cells (n = 3) (d), or human blood-derived T (n = 4) and B cells (n = 3) (e). *P < 0.05, ****P < 0.0001 (two-tailed unpaired t-test (b, d, e)). Bars represent mean ±SEM. Data are pooled from four experiments (a (mouse)) or representative of two experiments (d). Exact P values are in Source Data.

