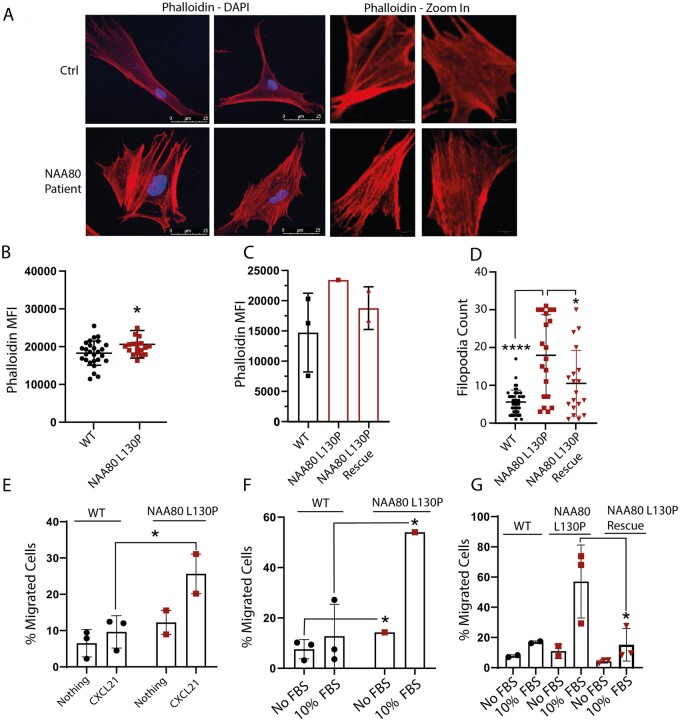
Figure 3.
NAA80 variants lead to increased actin polymerization, filopodia count and cellular migration. (A) Microscopy images of healthy Ctrl fibroblasts (upper panel) and NAA80 individual fibroblasts (lower panel) . NAA80 individual fibroblasts show increased filopodia counts and altered morphology of the polymerized actin network. (B) Phalloidin mean fluorescence intensity of healthy controls (N = 3, nine technical replicates) and NAA80 patient PBMCs (N = 2, nine technical replicates). Dots represent the mean phalloidin staining (median fluorescence intensity) of each replicate, the line represents the mean of all replicates ±SD ****P < 0.001 (Student’s t-test). (C) Phalloidin median fluorescence intensity of healthy controls (N = 3, one technical replicate each) and NAA80 individual fibroblasts (N = 1, one technical replicate) and fibroblasts of proband 1.2 expressing WT NAA80 with CMV or SV40 promoter (N = 2, both one replicate). Bar represents mean fluorescence intensity of the phalloidin staining ±SD. (D) Filopodia count of healthy control (N = 3) and individual fibroblasts (N = 1) transfected with an empty vector and SV40 promoter, and individual fibroblasts with NAA80 WT expressing plasmid with SV40 promoter (N = 1). Dots represent filopodia count per cell, lines represent mean filopodia count of all cells ±SD. *P < 0.05, ****P < 0.001 (ANOVA). (E) Cellular migration measured with the Boyden chamber assay of PBMCs with normal culture medium (nothing) or CXCL21 enriched culture medium (CXCL21) in the bottom chamber. Dots and squares represent mean migration of three technical replicates, bars represent mean migration of healthy controls combined (N = 3) or NAA80 individuals (N = 2) ±SD. *P < 0.05 (Student’s t-test). (F) Cellular migration of control and NAA80 individual fibroblasts, measured with the Boyden chamber assay, with normal culture medium without (No FBS) or with (10% FBS) enriched culture medium in the bottom chamber. Dots or squares represent mean migration of three technical replicates, bars represent mean migration percentage of three donors ±SD. *P < 0.05 (Student’s t-test). (G) Cellular migration of healthy control (N = 2) and NAA80 individual fibroblasts transduced with an empty vector (N = 1, three technical replicates) and NAA80 individual fibroblasts transduced with a NAA80 wild-type expressing vector (N = 1, three technical replicates). Bars represent mean migration per condition ±SD. *P < 0.05.

