Figure 5.

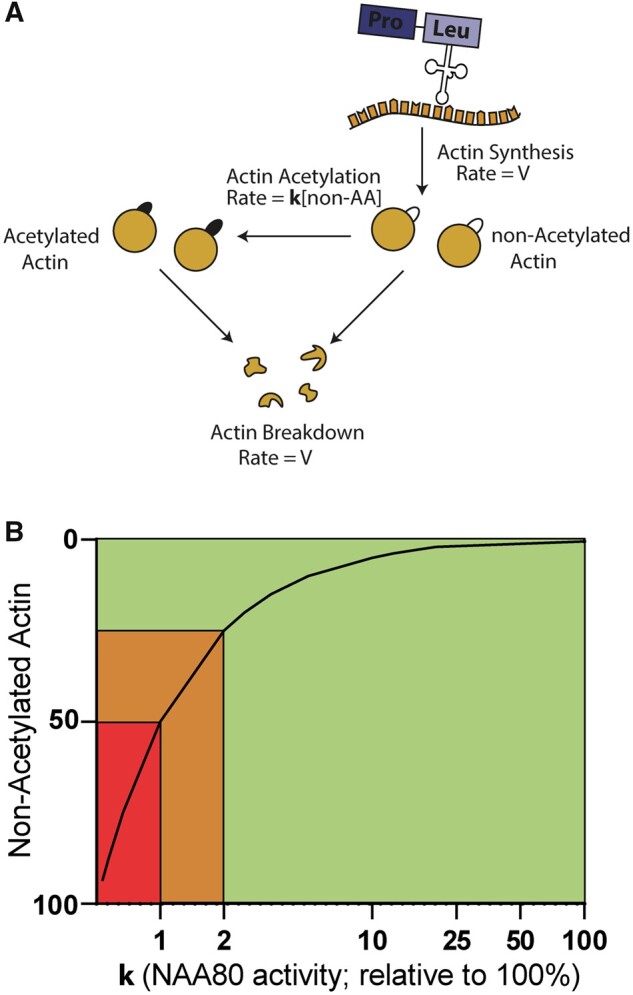
Graphical model showing the NAA80 activity (x-axis) versus the amount of substrate (non-acetylated actin, y-axis). (A) Under steady-state conditions, actin is synthesized, acetylated and degraded. For the sake of simplicity, we assume that the degradation of acetylated and non-acetylated actins proceed with the same rate constant. If we assume that the rate of acetylation is proportional to the non-acetylated actin (non-AA) concentration, V = k [non-AA], where k is the constant rate of the reaction catalysed by NAA80. The concentration of non-AA is therefore equal to V/k. (B) An increase in the proportion of non-acetylated actin from 0.5% (normal value) to 25% or 50% may be due to a reduction in the NAA80 activity of 50- and 100-fold, respectively (i.e. from a value of 100% to 2 or 1% approximately). Therefore, the reduced NAA80 activity caused by NAA80 genetic variants in our individuals falls within a critical range (orange area) that is disease-causing but not lethal. Less than 1% NAA80 activity is thought to be lethal (red area). Over 2% of NAA80 residual activity probably does not result in overt clinical symptoms (green area). Note that all percentages mentioned are based on estimates. Note that the x-axis has a logarithmic scale.
