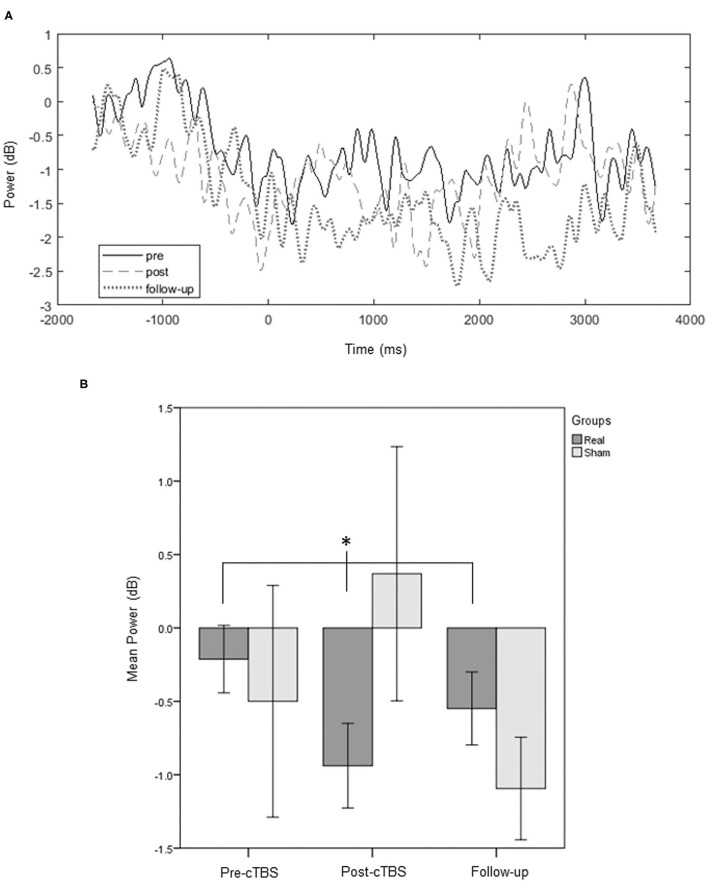
Figure 5.
Time-response plots of the mean beta power. A group average response of the ipsilesional motor area for an average of the channels of interest (FC3 or 4; FC1 or 2; C3 or 4; C1 or 2; Cz; CP3 or 4; CP1 or 2) is represented, for the experimental group, throughout the three assessment points. Pre-movement and preparation of the affected thumb opposition reveal changes induced by the protocol on beta power of the affected hemisphere (A). Significant differences (*p < 0.05) are also illustrated in the bars chart (B). Error bars represent ±1 SE.

