Fig. 3.

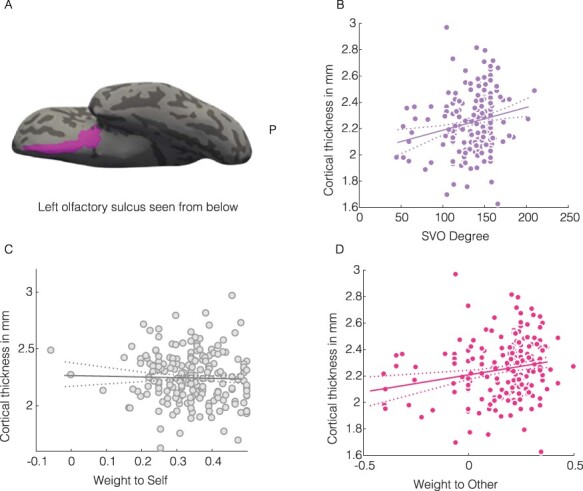
Cortical thickness of the left olfactory sulcus (OS) relates to social preferences. (A) View of left OS from below on an inflated surface. (B) SVO degree—OS pairs with best fitting linear regression, controlling for age, gender, and average thickness of the left hemisphere. (C) Cortical thickness of the left olfactory sulcus and weight to self. Solid line represents the regression coefficient of weight to self after controlling for age, gender, weight to other, and average thickness of the left hemisphere. (D) Cortical thickness of the left olfactory sulcus and weight to other. Solid line represents the regression coefficient of weight to other after controlling for age, gender, weight to self and average thickness of the left hemisphere. Dashed lines represent the 95% confidence interval. Dots represent individual participants.
