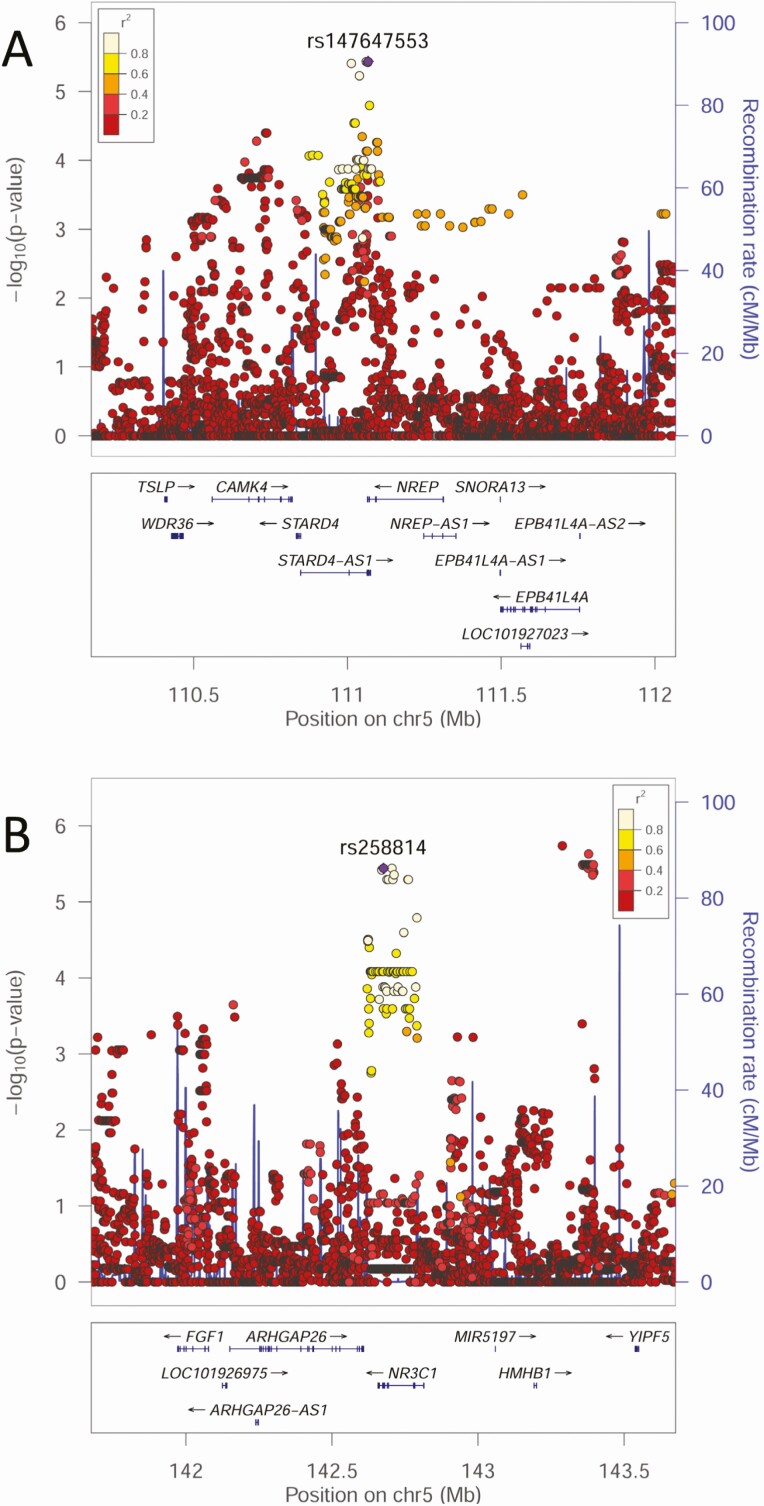
Figure 2.
LocusZoom plots for GWAS associations identified as plausible genetic risk factors for severe OM following post-GWAS annotation: (A) NREP and (B) NR3C1. The –log10P values (left y-axis) are shown in the top section of each plot. Dots representing individual SNVs are color coded (see key) based on their population-specific LD r2 with the top SNV (annotated by rs ID) in the region. The right Y-axis is for recombination rate (blue line), based on HapMap data. The bottom section of each plot shows the positions of genes across the region. Abbreviations: GWAS, genome-wide association studies; LD, linkage disequilibrium; OM, otitis media; SNV, single nucleotide variants.

