Fig. 1.
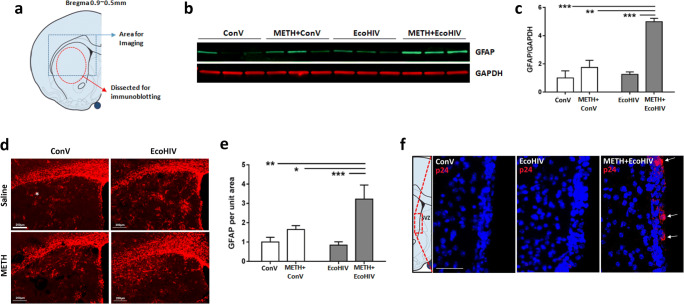
Validation of METH and EcoHIV neurotoxicity and neuroinflammation model. a The brain regions used for the analysis of METH- and/or EcoHIV-induced neurotoxicity and neuroinflammation. Freshly collected mouse brains were cross-cut at the bregma 0.9~0.5 mm and the caudate putamen (CP) region, indicated as a dashed circle, was dissected and analyzed by immunoblotting. The dashed rectangle was the region from the frozen brain sections which was examined by immunostaining and confocal imaging. b A representative immunoblotting of GFAP in the CP region. Mice were treated with METH and/or infected with EcoHIV or control virus as described in the “Materials and Methods” section. GAPDH was used for loading control. c Quantitative results of METH- and/or EcoHIV-induced GFAP expression from (b). The intensity of the bands corresponding to GFAP was normalized to the corresponding GAPDH intensity, and the mean and SEM were calculated. N=6 per group; two-way ANOVA; **, p<0.01; ***, p<0.005. d A representative immunostaining for GFAP. Analyses were performed on frozen brain sections visualized in (a) and imaged by confocal microscopy. Scale bar, 200 μm. e Quantitative results of GFAP immunostaining from (d). The unit intensity of each image was calculated as total fluorescence intensity divided by the total area measured. N=6 per group; two-way ANOVA; **, p<0.01; ***, p<0.005. f EcoHIV infection in the SVZ. Frozen sections of the SVZ from the treated animals were immunostained for p24 (red). Analyses were performed 2 weeks after EcoHIV infusion. p24 positive immunoreactivity (arrows) was detected only in METH-exposed and EcoHIV-infected brains. Scale bar, 40 μm

