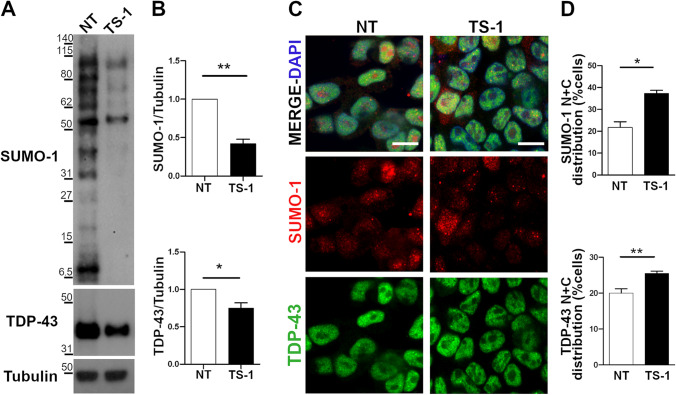
Fig. 6.
TDP-43 nucleocytoplasmic distribution upon treatment with the cell-permeable TS-1 peptide. (a–b) Representative WB images and densitometric analyses of total SUMO-1 and TDP-43 protein levels before (NT) and after TS-1 treatment (5 µM, 4 h) in SK-N-BE cells. α-Tubulin was used for data normalization (mean ± s.e.m; n = 5 independent experiments; Unpaired t-test; *p < 0.05; **p < 0.01). (c) IF images of endogenous TDP-43 (green) and SUMO-1 (red) proteins in untreated (NT) and TS-1-treated SK-N-BE cells. DAPI was used for nuclei staining. Scale bar, 10 µm. (d) Statistical analyses of the nuclear and cytoplasmic (N + C) distribution of the endogenous SUMO-1 and TDP-43 proteins in TS-1-treated and control (NT) conditions (mean ± s.e.m.; n = 4 independent experiments; at least 100 cells analysed/condition; Unpaired t-test; *p < 0.05; **p < 0.01)

