Fig. 3.

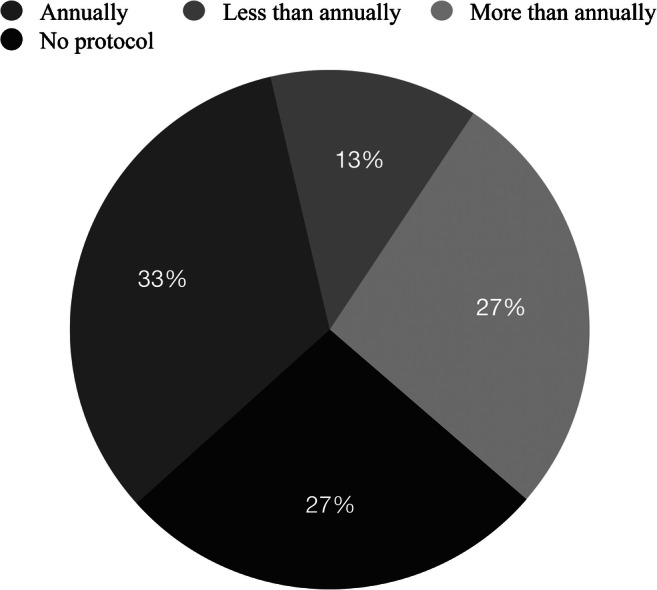
Pie chart shows frequency of follow-up for Fontan-associated liver disease at different centers. Among respondents whose institutions performed follow-up imaging, 4/15 (27%) reported not having a protocol at their institution

Pie chart shows frequency of follow-up for Fontan-associated liver disease at different centers. Among respondents whose institutions performed follow-up imaging, 4/15 (27%) reported not having a protocol at their institution