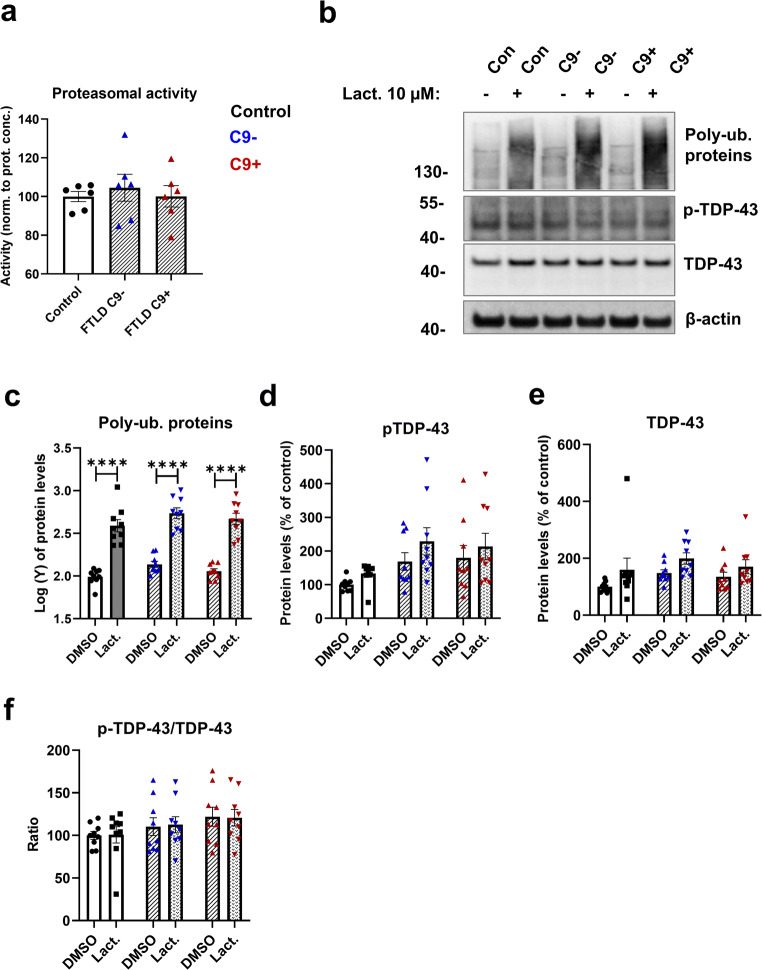
Fig. 5.
Proteasomal activity is unaffected, and levels of TDP-43 and p-TDP-43 are unchanged by proteasomal inhibition. a Proteasomal activity. Data are shown as mean ± SEM. One-way ANOVA followed by Tukey’s multiple comparison test was performed. Only p values that were significant in the post hoc test are indicated in the graphs. Data were obtained from two independent experiments. Datapoints represent the average of two or three biological replicates. b Representative Western blot images from poly-ubiquitinated proteins, p-TDP-43, TDP-43, and β-actin from fibroblast cell lysates. Cells were treated with 10 μM lactacystin overnight to block protein degradation through the UPS. DMSO was used as a vehicle. c Quantification of poly-ubiquitinated proteins. d Quantification of p-TDP-43. e Quantification of TDP-43. f Ratio of p-TDP-43/TDP-43. Two-way ANOVA followed by Tukey’s multiple comparison test was performed. Only p values that were significant in the post hoc test are indicated in the graphs. Data in panel (c) were transformed prior to two-way ANOVA. n = 9 control, n = 9 FTLD with C9-HRE, and n = 9 FTLD without C9-HRE. ****p ≤ 0.0001

