Fig. 6.
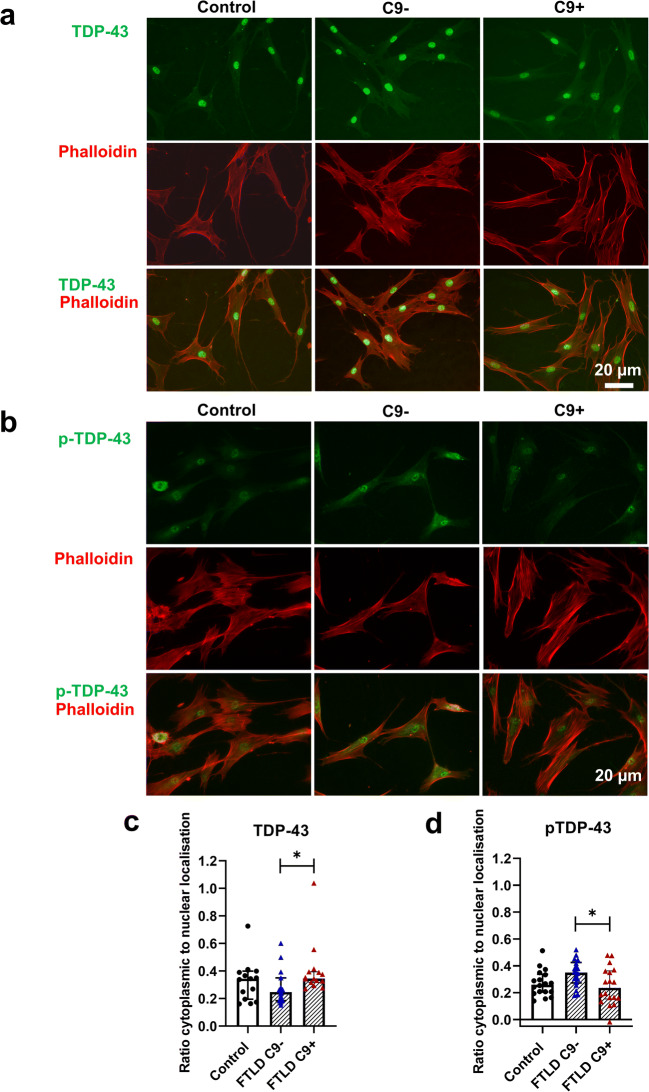
Subcellular localization of TDP-43 and p-TDP-43 are not affected in FTLD patient–derived fibroblasts compared to healthy controls. a Representative fluorescence microscopy images of staining with anti-TDP-43 antibody (green) and Phalloidin (red) in fibroblasts of control (left column), FTLD patient without (C9-; middle column), and FTLD patient with the C9-HRE (C9+; right column). b Representative fluorescence microscopy images of staining with anti-p-TDP-43 antibody (green) and Phalloidin (red) in fibroblasts of control (left column), FTLD patient without (middle column), and FTLD patient with the C9-HRE (right column). c Ratio of cytoplasmic to nuclear localization of TDP-43. d Ratio of cytoplasmic to nuclear localization of p-TDP-43. Data are shown as mean ± SEM, and one-way ANOVA followed by Sidak’s multiple comparison test was performed. Number of images analyzed: n = 15 for control and n = 15 FTLD with C9-HRE and n = 15 FTLD without C9-HRE from one experiment. *p ≤ 0.05

