Fig. 7.
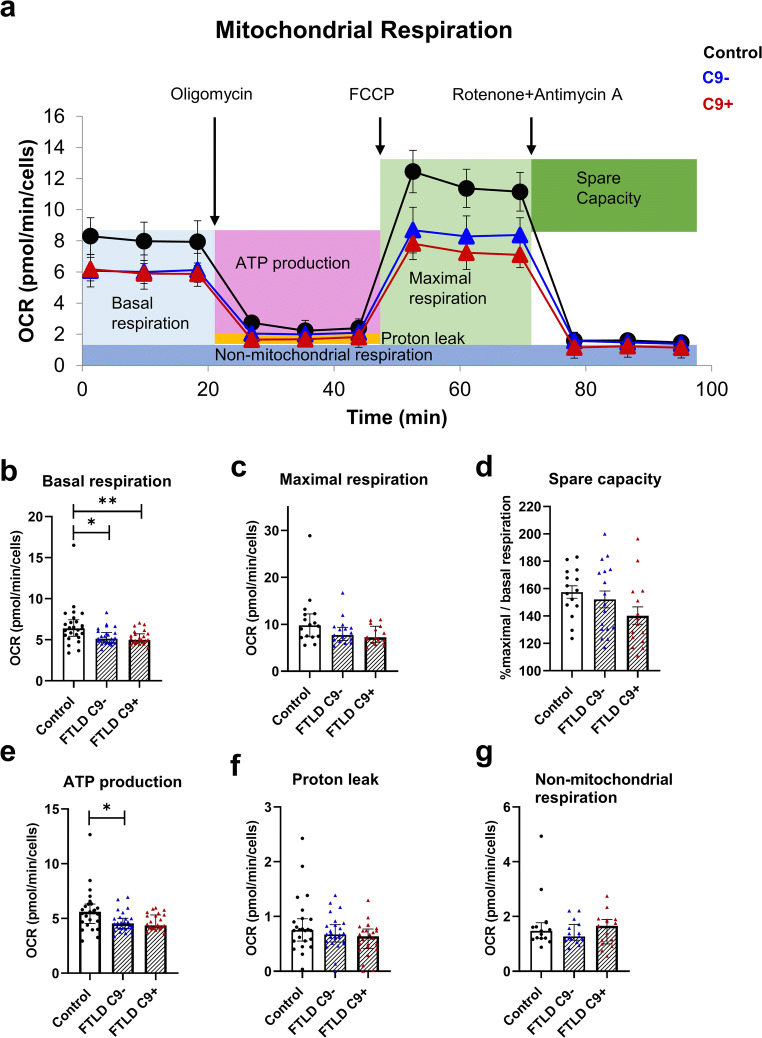
The mitochondrial metabolism of FTLD patient–derived fibroblasts is impaired. Using the Cell Mito Stress Test, several parameters of mitochondrial function were assessed. a Example of Cell Mito Stress Test with one control, one C9+, and one C9− fibroblast line. Using the Mito Stress Test assay, several parameters of mitochondrial function were assessed. b Quantification of basal respiration. c Quantification of maximal respiration. d Quantification of spare capacity. e Quantification of ATP production. f Quantification of proton leak. g Quantification of non-mitochondrial respiration. Data are shown as median ± interquartile range and Kruskal–Wallis followed by Dunn’s multiple comparison test was performed (b, c, e, f). Data are shown as mean ± SEM, and one-way ANOVA followed by Sidak’s multiple comparison test was performed (d). Only p values that were significant in the post hoc test are indicated in the graphs. n = 15 control, n = 15, FTLD with C9-HRE and n = 15 FTLD without C9-HRE for maximal respiration and spare capacity and n = 24 control, n = 24 FTLD with C9-HRE and n = 24 FTLD without C9-HRE for other parameters. *p ≤ 0.05; **p ≤ 0.01

