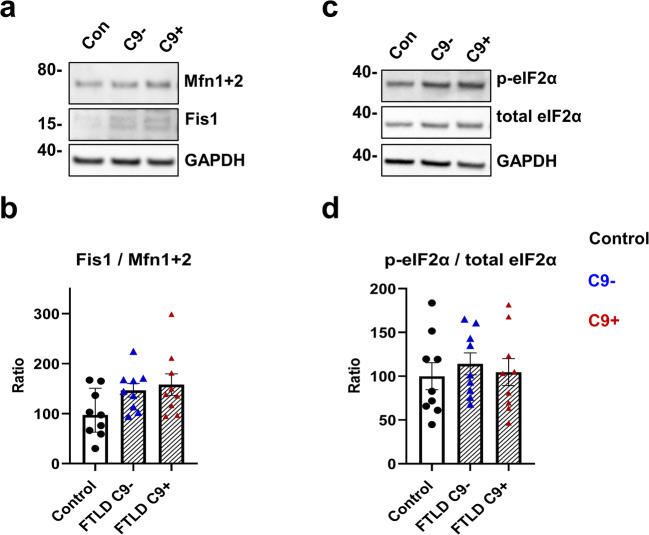
Fig. 8.
FTLD patient–derived fibroblasts show a trend of increased fission/fusion ratio, but no changes in phosphorylation of eIF2α. a Representative Western blot images from Fis1 and Mfn1+2 from fibroblast cell lysates. b Ratio of Fis1/ Mfn1+2. c Representative Western blot images from p-eIF2α and total eIF2α from fibroblast cell lysates. d Ratio of p-eIF2α/total eIF2α. Data are shown as the mean of three biological replicates ± SEM with ratio in controls set to 100. One-way ANOVA followed by Sidak’s multiple comparison test was performed. Only p values that were significant in the post hoc test are indicated in the graphs. n = 9 control, n = 9 FTLD with C9-HRE and n = 9 FTLD without C9-HRE

