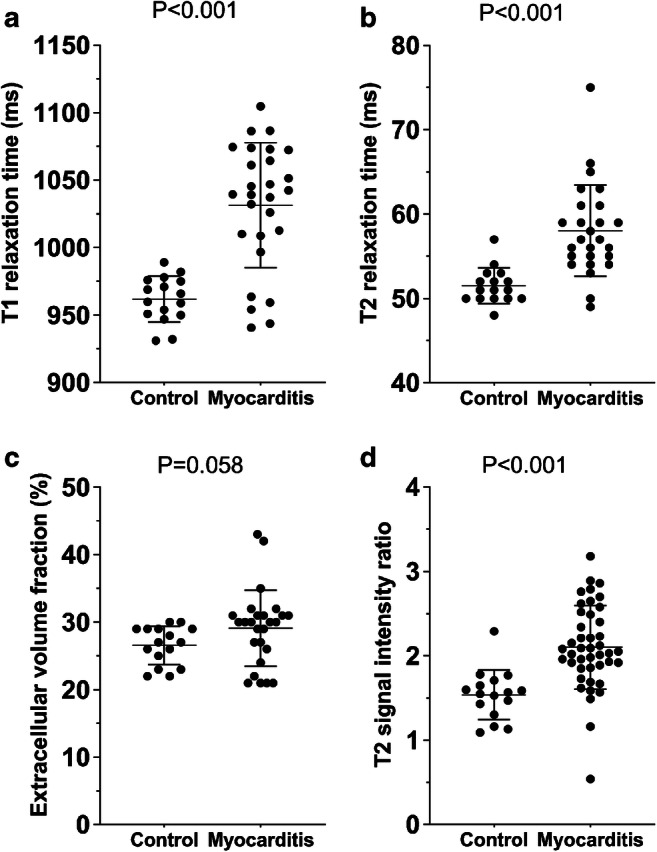
Fig. 1.

Graphs with individual plotted values show the distribution of myocardial magnetic resonance parameters in controls and in the subgroup of patients with myocarditis and available mapping parameters (26/43 patients and 16/16 controls). a T1 relaxation time. b T2 relaxation time. c Extracellular volume fraction. d T2 signal intensity ratio. T2 signal intensity ratio was available in all patients and controls. Individual values are represented as single dots. The horizontal lines show the mean values with error bars representing one standard deviation. P-values were obtained using an unpaired Student’s t-test
