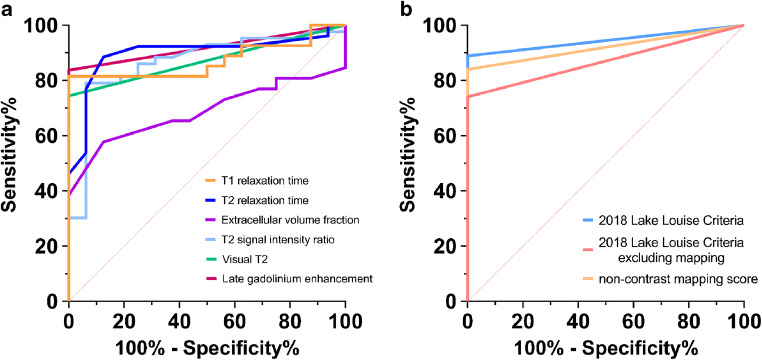
Fig. 2.
Graphs show receiver operating characteristic (ROC) curves for the subgroup cohort of patients (26/43) and control patients (16/16) with available mapping parameters. a The individual performance of different cardiac magnetic resonance parameters are presented: native T1 relaxation time (area under the curve [AUC]: 0.873), T2 relaxation time (AUC: 0.899), extracellular volume (AUC: 0.687), T2 signal intensity ratio (AUC: 0.868) and late gadolinium enhancement (AUC: 0.919). b The performance of combined scores is visualized: 2018 Lake Louise criteria (AUC: 0.944), 2018 Lake Louise criteria excluding mapping parameters (AUC: 0.870), and a non-contrast score of native T1 and T2 relaxation times only (AUC: 0.920)

